PSINS惯导算法调试与公开数据集测试
Published:
PSINS惯导算法公开数据集测试
本文所使用的是由西北工业大学严恭敏老师开源的PSINS算法。
仿真数据测试
%%
close all;clear;
glvs
ts = 0.1; % sampling interval
avp0 = [[0;0;0]; [0;0;0]; glv.pos0]; % init avp
% trajectory segment setting
xxx = [];
seg = trjsegment(xxx, 'init', 0);
seg = trjsegment(seg, 'uniform', 40);
seg = trjsegment(seg, 'accelerate', 20, xxx, 1);
seg = trjsegment(seg, 'uniform', 100);
seg = trjsegment(seg, 'turnleft', 10*5, 1, xxx, 4);
seg = trjsegment(seg, 'uniform', 100);
seg = trjsegment(seg, 'turnright', 45, 2, xxx, 4);
seg = trjsegment(seg, 'uniform', 100);
seg = trjsegment(seg, 'climb', 30, 2, xxx, 50);
seg = trjsegment(seg, 'uniform', 60);
seg = trjsegment(seg, 'turnleft', 10*5, 3, xxx, 4);
seg = trjsegment(seg, 'deaccelerate', 10, xxx, 2);
seg = trjsegment(seg, 'uniform', 60);
seg = trjsegment(seg, 'descent', 30, 2, xxx, 50);
seg = trjsegment(seg, 'uniform', 100);
% generate, save & plot
trj = trjsimu(avp0, seg.wat, ts, 1);
trjfile('trj0516.mat', trj);
insplot(trj.avp);
imuplot(trj.imu);
% pos2gpx('trj_SINS_gps', trj.avp(1:round(1/trj.ts):end,7:9)); % to Google Earth
%%
close all;clear;
glvs
trj = trjfile('trj0516.mat');
% error setting
imuerr = imuerrset(0.01, 100, 0.001, 10);
imu = imuadderr(trj.imu, imuerr);
davp0 = avperrset([0.5;0.5;5], 0.1, [10;10;10]);
avp00 = avpadderr(trj.avp0, davp0);
trj = bhsimu(trj, 1, 10, 3, trj.ts);
% pure inertial navigation & error plot
avp = inspure(imu, avp00, trj.bh, 1);
% avp = inspure(imu, avp00, 'f', 1);
avperr = avpcmpplot(trj.avp, avp);
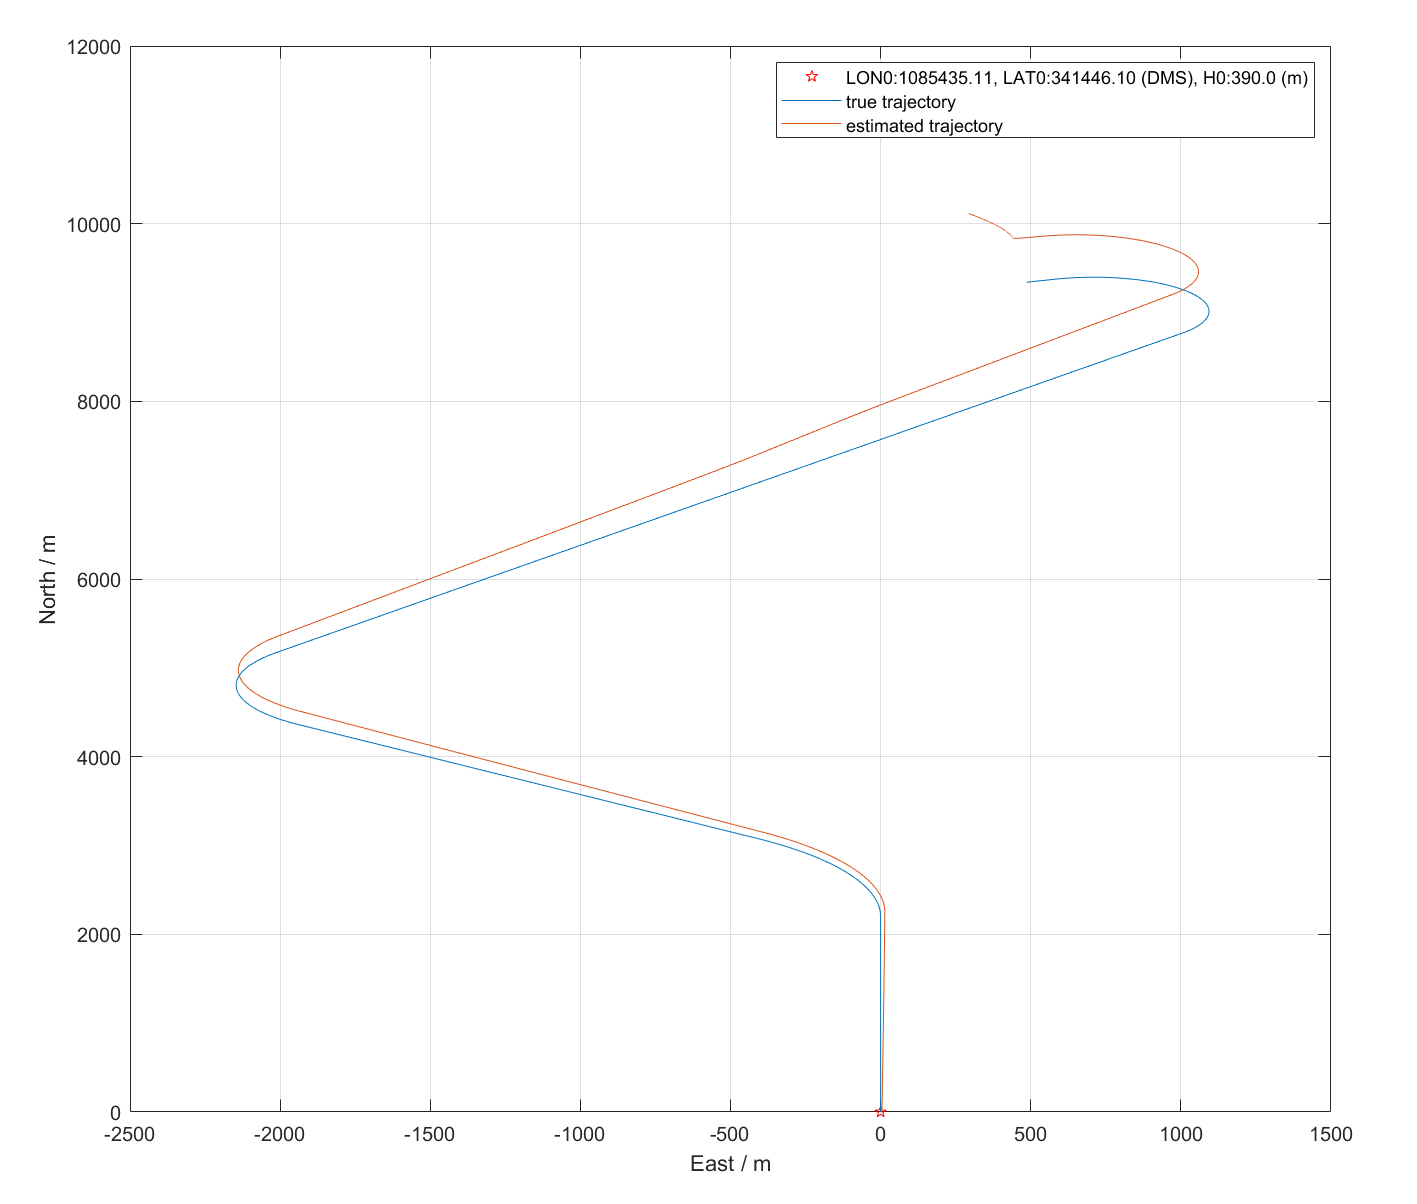
myfigure;
dxyz = pos2dxyz(trj.avp(:,7:9));
plot(0, 0, 'rp'); % 19/04/2015
hold on, plot(dxyz(:,1), dxyz(:,2)); xygo('est', 'nth');
dxyz = pos2dxyz(avp(:,7:9));
hold on, plot(dxyz(:,1), dxyz(:,2)); xygo('est', 'nth');
legend(sprintf('LON0:%.2f, LAT0:%.2f (DMS), H0:%.1f (m)', r2dms(avp(1,8)),r2dms(avp(1,7)),avp(1,9)),'true trajectory','estimated trajectory');
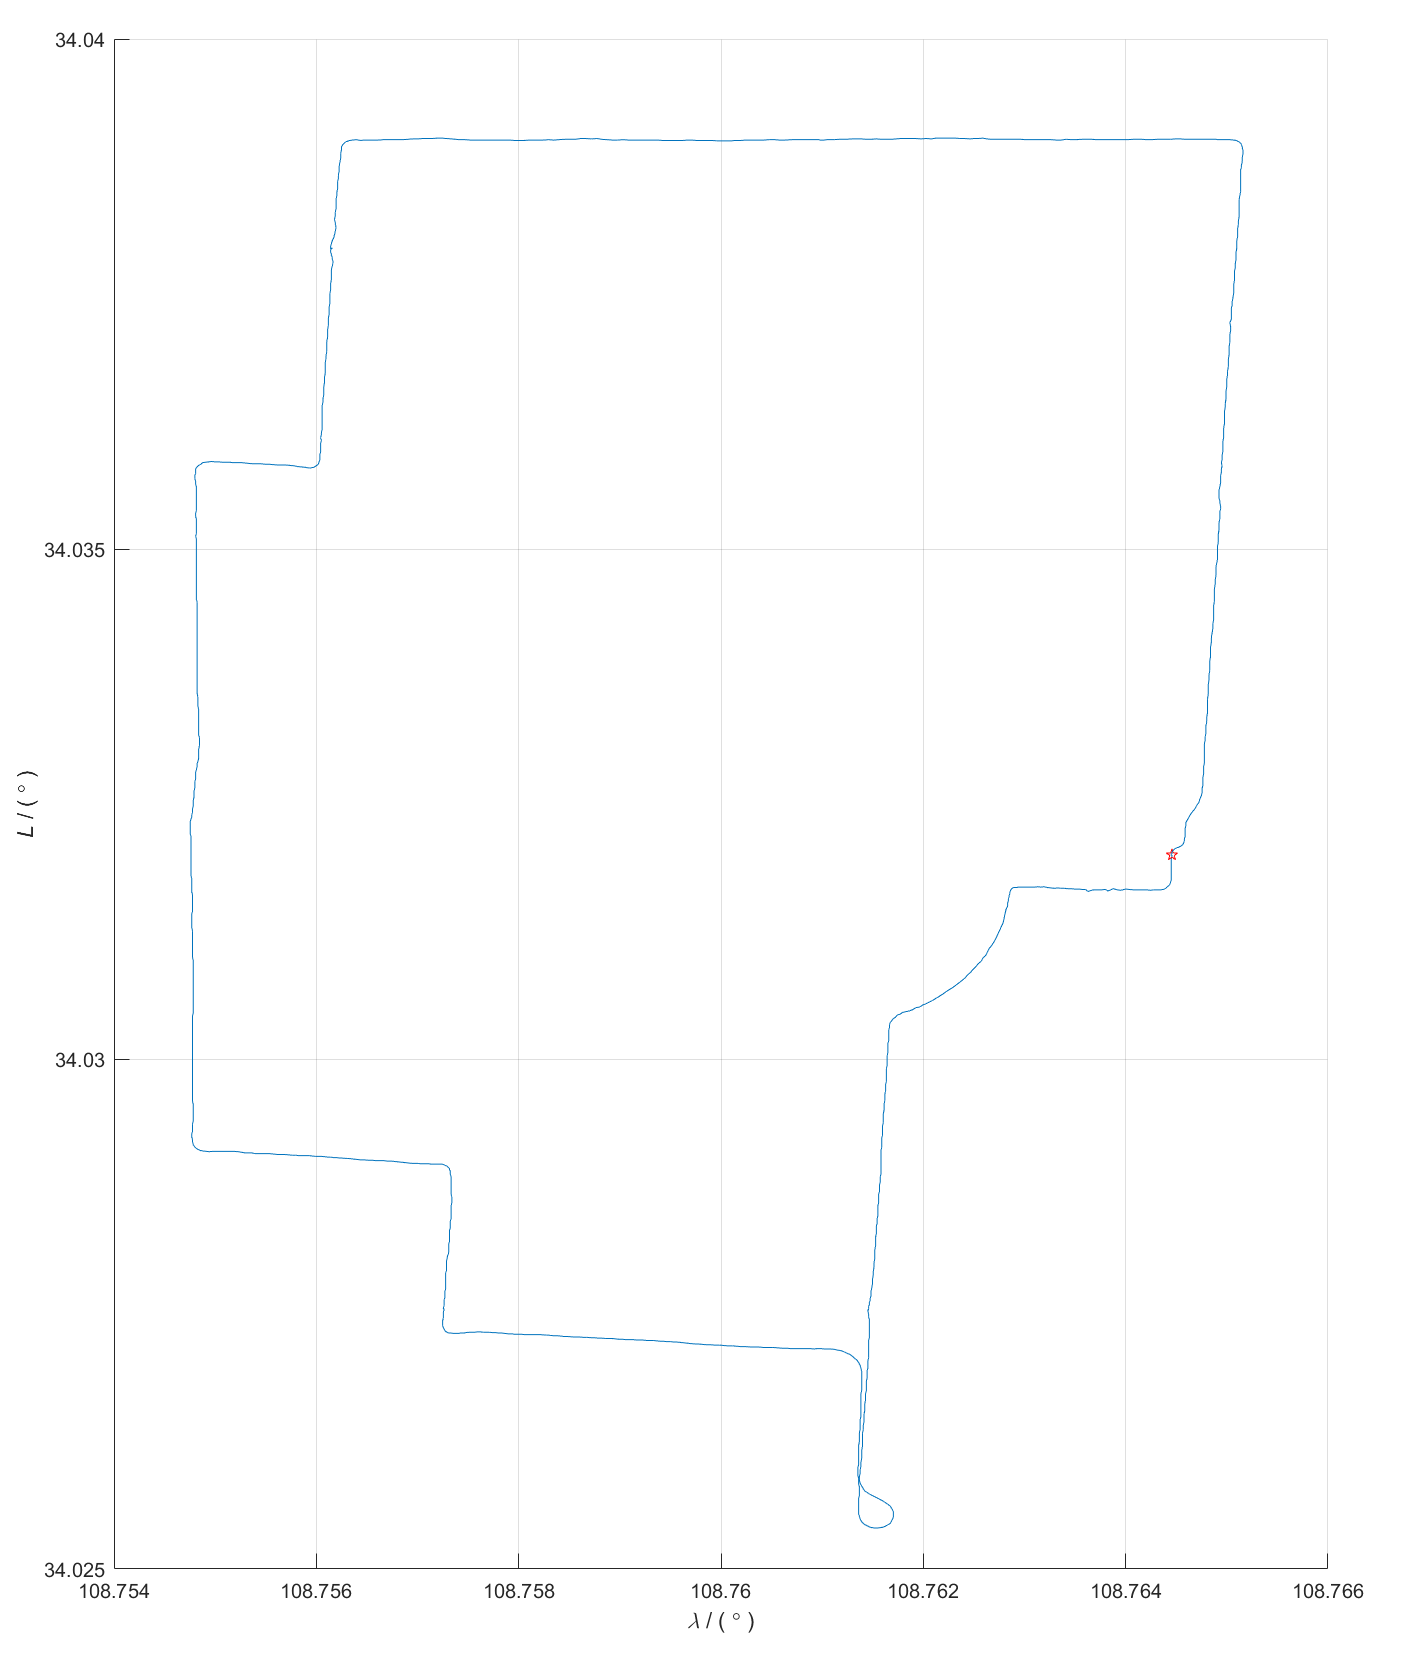
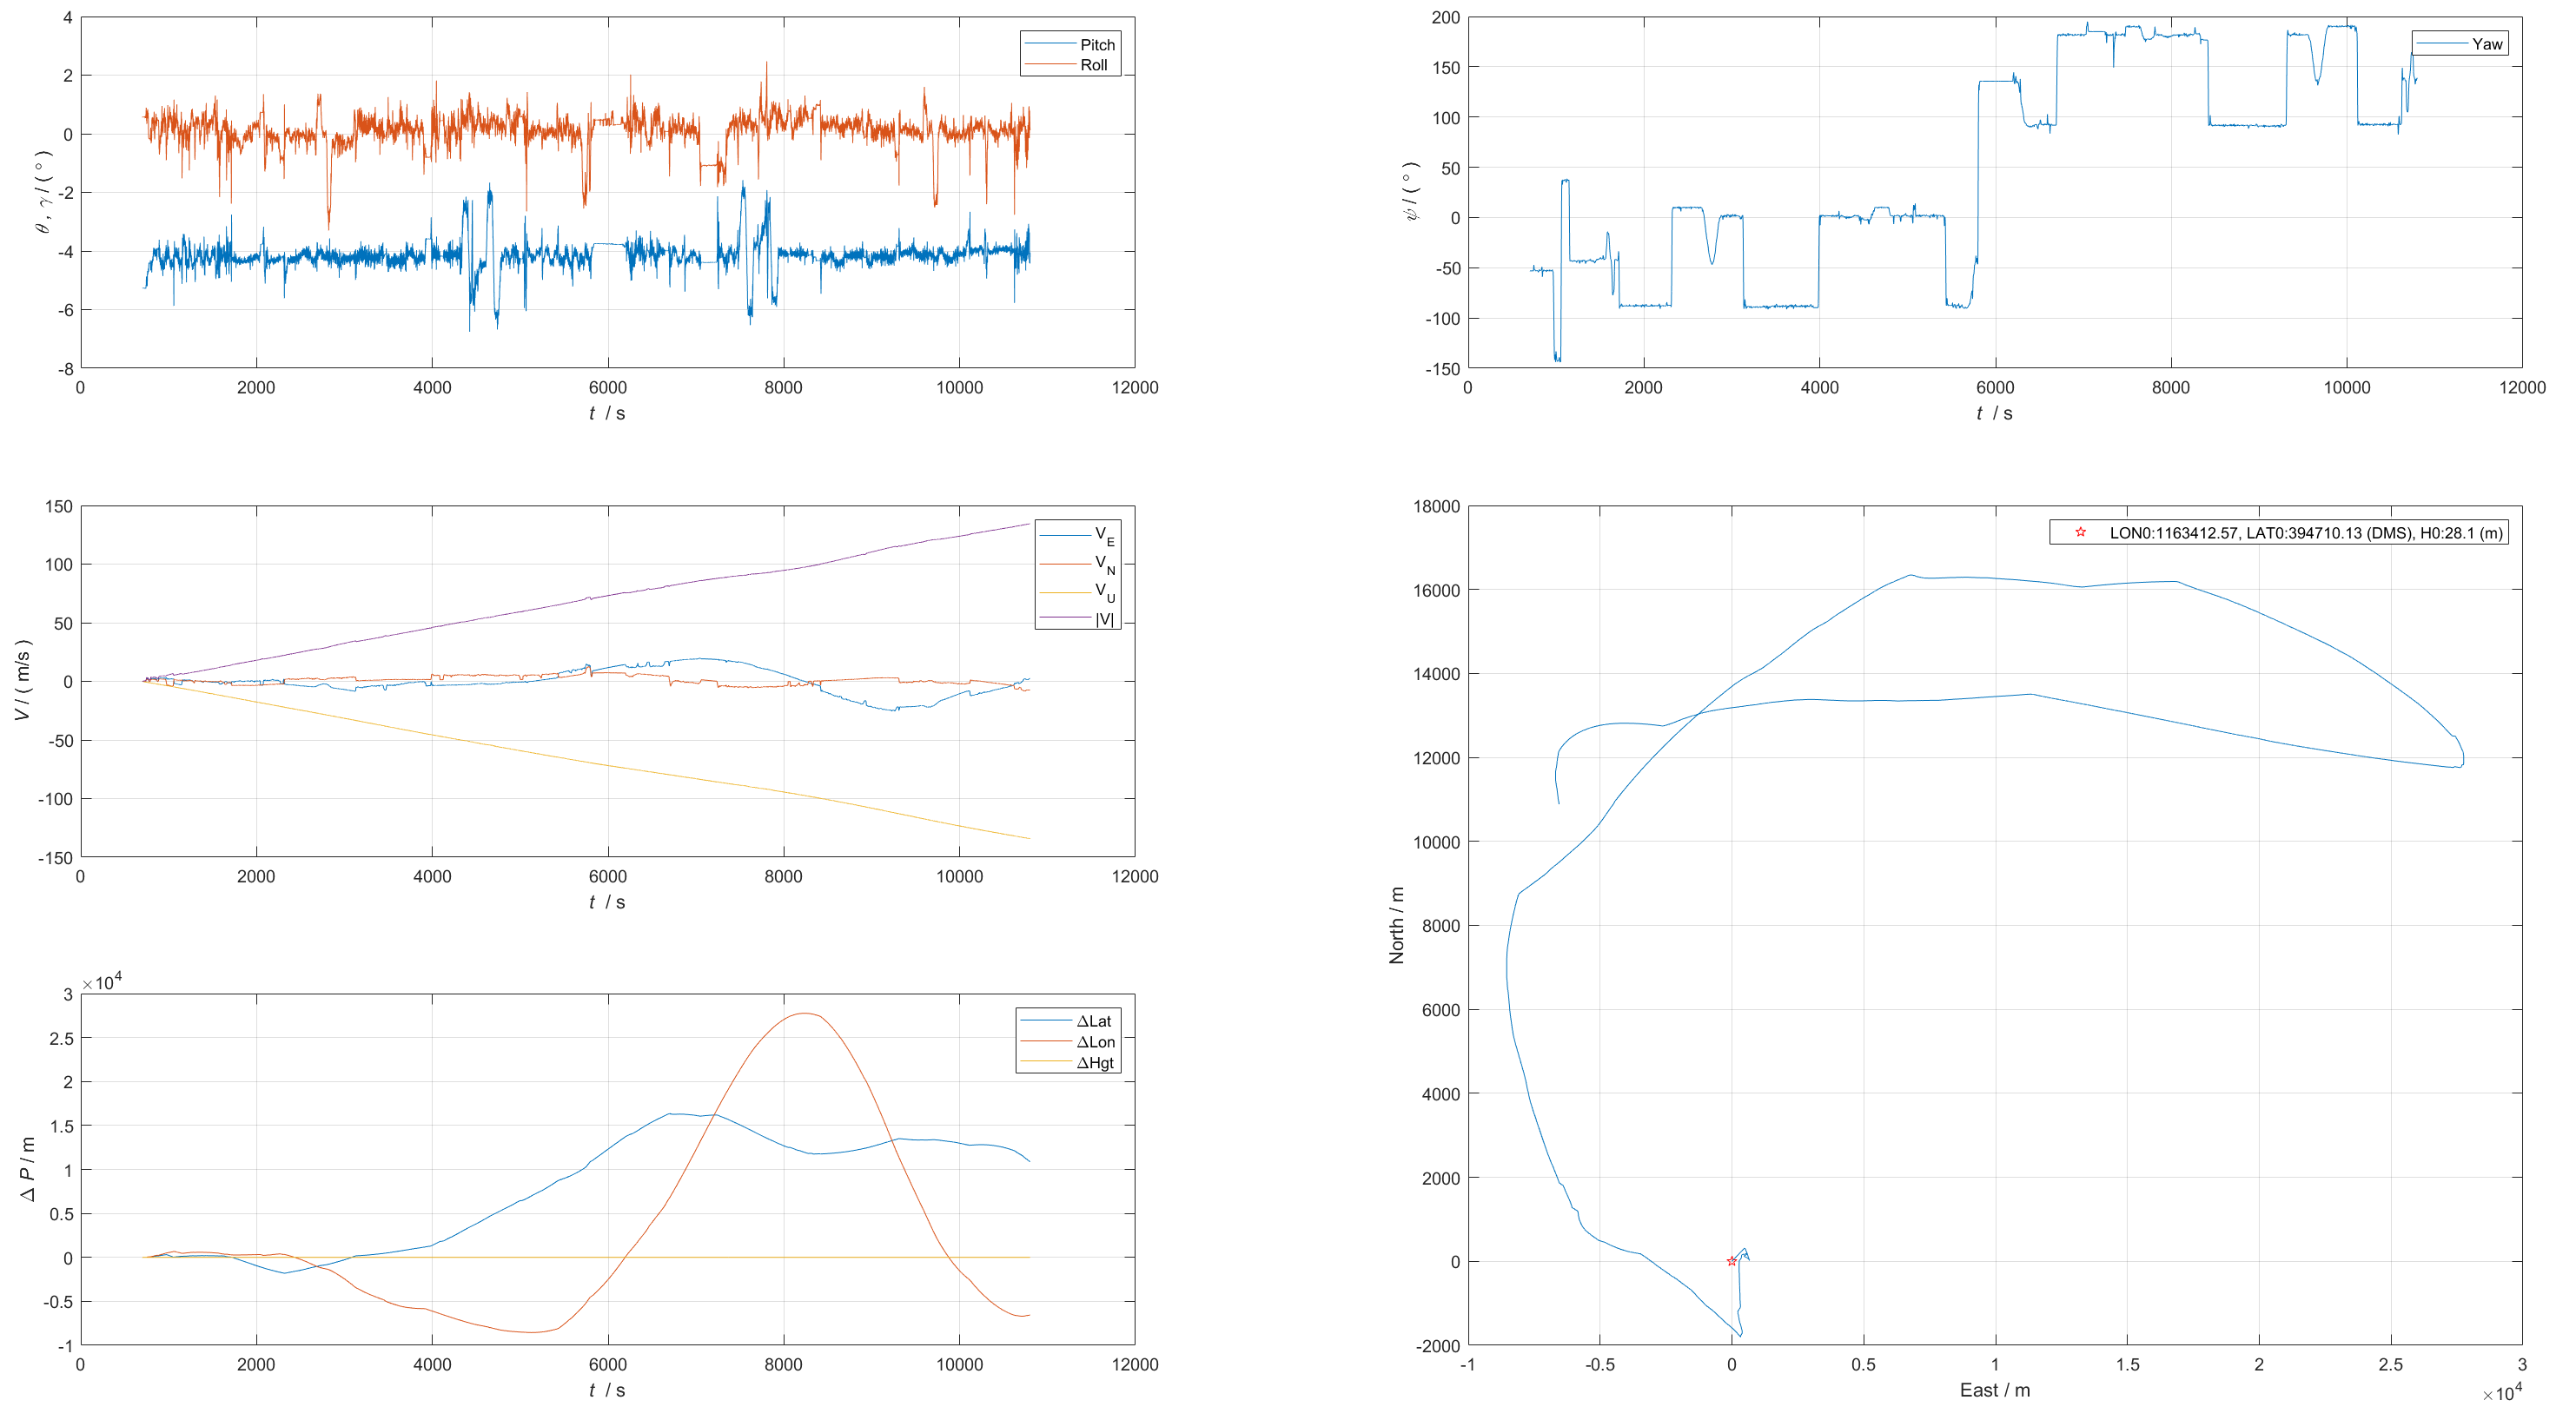
导航轨迹:
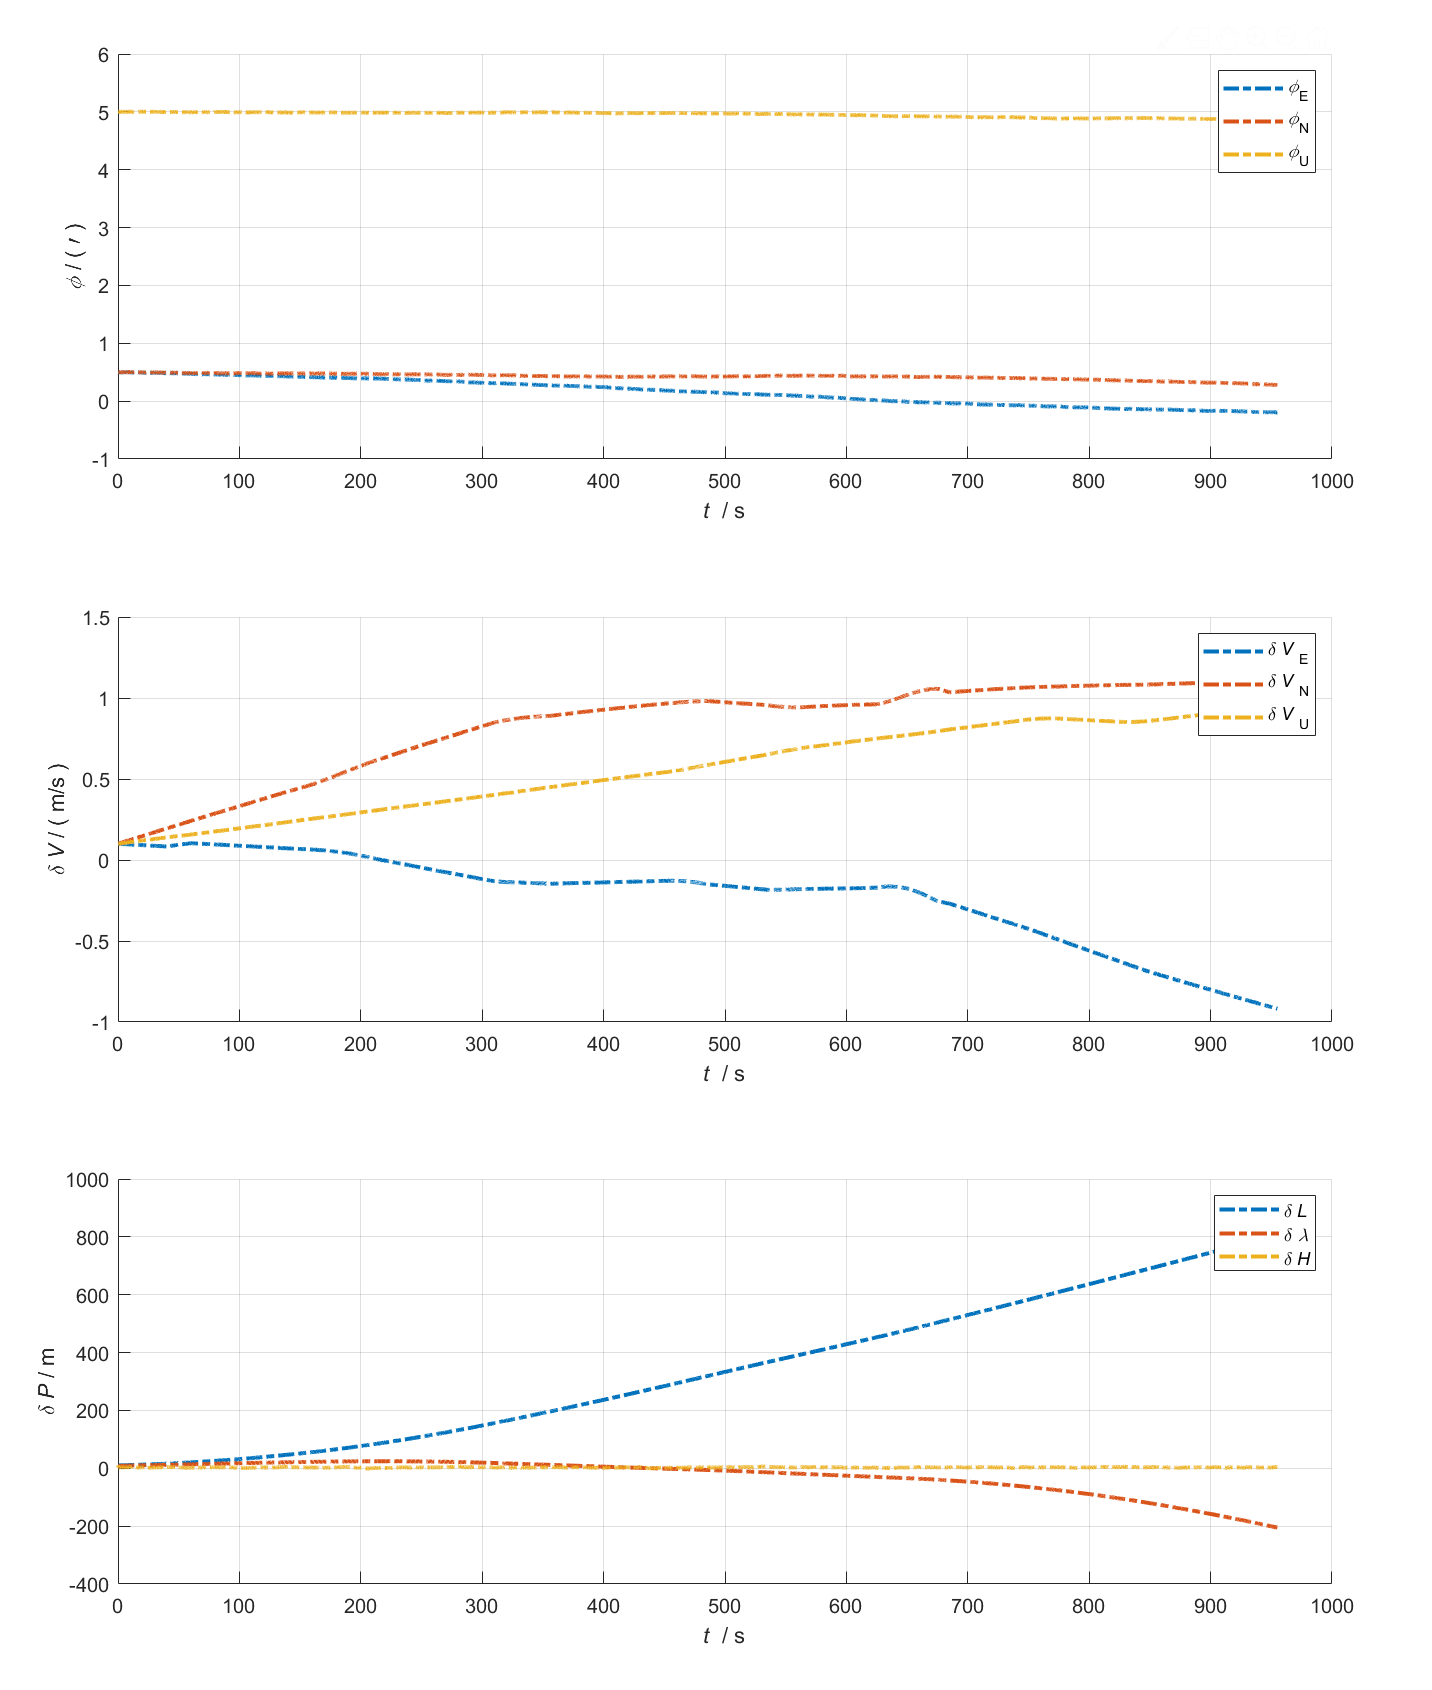
导航误差:
测试数据集1
一组惯导-卫导-天文跑车数据(由西安中科华芯测控有限公司提供)
惯性级激光惯导频率200Hz;GPS单点定位1Hz;
CNS为大视场星敏,标称精度20角秒,星敏输出星敏相对于惯性系的姿态四元数q^i_s,1Hz采样,动态测量范围小于2°/s。
跑车地点在西工大长安校区,时长约2000s (33min)。
数据读取的Matlab/PSINS Toolbox程序:
glvs;
ts = 1/200;
load imugpscns20211109.mat;
% imuplot(imu); gpsplot(gps);
atts = qis(:,1:4);
Cie = cnsCie(t00(1:3), t00(4), -0.107, 37); % t00 is the UTC first sampling epoch
for k=1:length(qis)
    Cen = pos2cen(getat(gps(:,4:7),qis(k,5)));
    Cin = Cie*rxyz(qis(k,5)*glv.wie,'z')*Cen;
    atti = m2att(Cin'*q2mat(qis(k,:))); % Cns
    atts(k,:) = [ atti; qis(k,5) ]';
end
insplot(atts,'a');
att = aligni0(datacut(imu,100,300), gps(1,4:6)');
avp = inspure(datacut(imu,300,inf), [att;gps(1,4:6)'], 'H');
avpcmpplot(atts, avp(:,[1:3,end]), 'a', 'mu');
%% IMU-GPS-CNS
close all;clear;
glvs;
ts = 1/200;
load imugpscns20211109.mat;
imuplot(imu);
gpsplot(gps);
atts = qis(:,1:4);
Cie = cnsCie(t00(1:3), t00(4), -0.107, 37); % t00 is the UTC first sampling epoch
for k=1:length(qis)
Cen = pos2cen(getat(gps(:,4:7),qis(k,5)));
Cin = Cie*rxyz(qis(k,5)*glv.wie,'z')*Cen;
atti = m2att(Cin'*q2mat(qis(k,:))); % Cns
atts(k,:) = [ atti; qis(k,5) ]';
end
insplot(atts,'a');
att = aligni0(datacut(imu,100,300), gps(1,4:6)');
avp = inspure(datacut(imu,300,inf), [att;gps(1,4:6)'], 'H');
% avpcmpplot(atts, avp(:,[1:3,end]), 'a', 'mu');
%%%%%%%%%%%%%%%%%%%%%%%%%%%%%%%%%%%%%%%%%%%%%%%%%%%%%%%
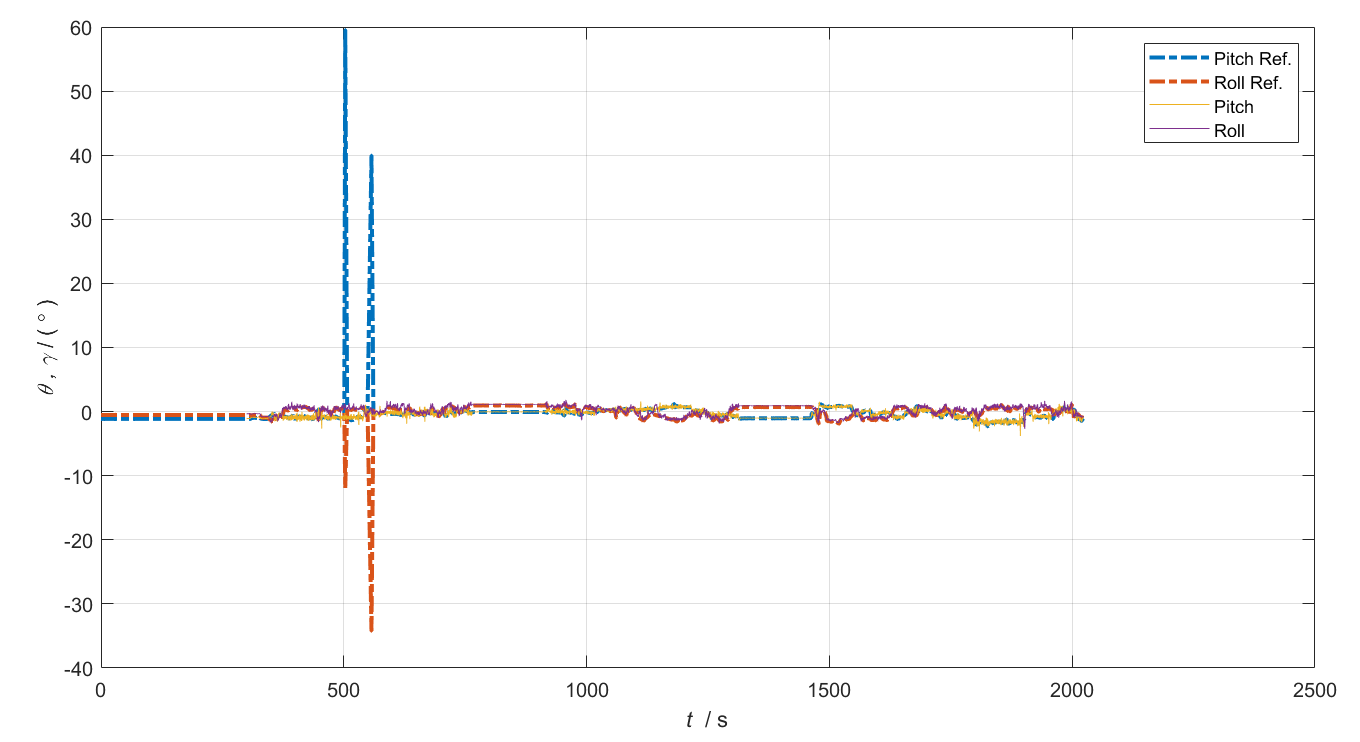
% error of pitch, roll and yaw between pure ins and cns
myfigure;
t1 = atts(:,end);
t2 = avp(:,end);
subplot(221), plot(t1, atts(:,1:2)/glv.deg,'-.','LineWidth',2), xygo('pr');
hold on, plot(t2, avp(:,1:2)/glv.deg), xygo('pr'); %legend('Pitch','Roll');
legend('Pitch Ref.', 'Roll Ref.', 'Pitch', 'Roll');
%subplot(223), plot(t, avp(:,3)/glv.deg), xygo('y'); legend('Yaw Ref.');
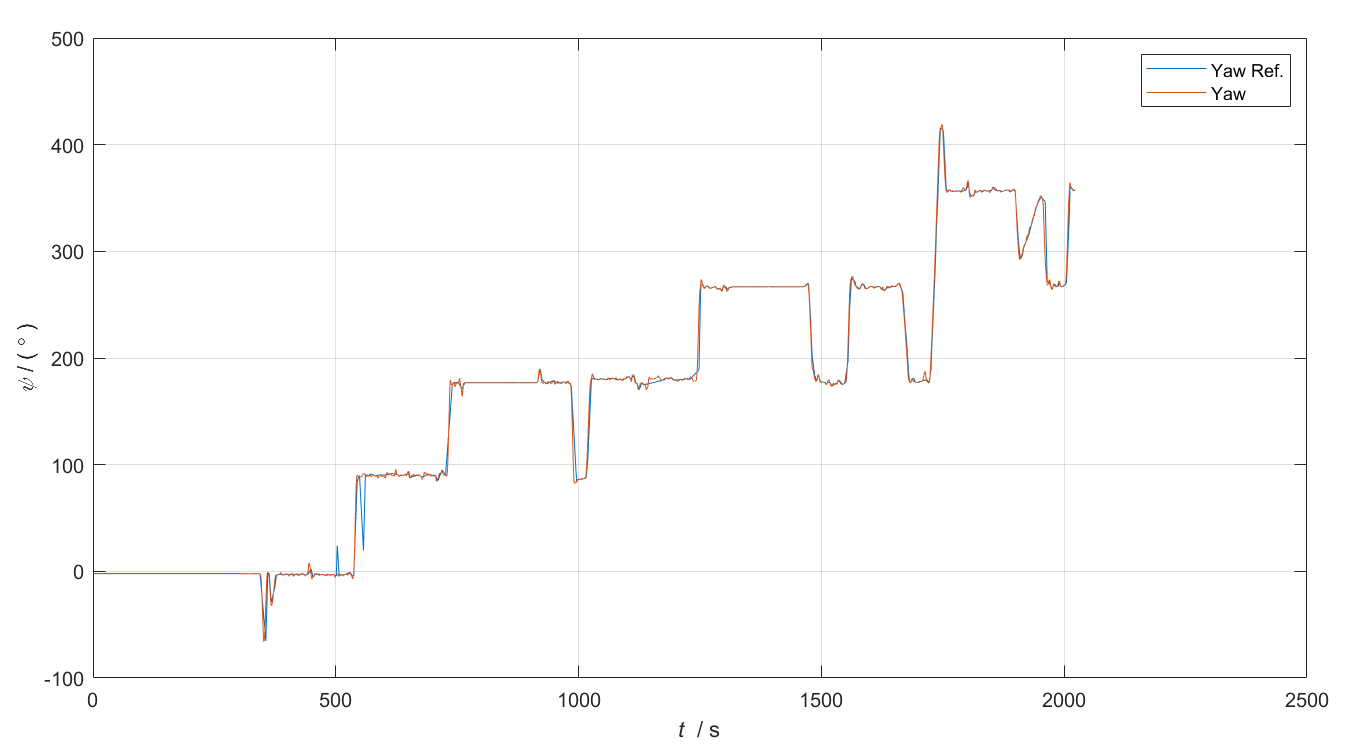
subplot(223), plot(t1, yawplot(atts(:,3)/glv.deg)), xygo('y');
%subplot(223), hold on, plot(t, avp(:,3)/glv.deg, strk, 'LineWidth',2), xygo('y'); legend('Yaw');
hold on, plot(t2, yawplot(avp(:,3)/glv.deg)), xygo('y'); %legend('Yaw');
legend('Yaw Ref.', 'Yaw');
err = avpcmp(avp(:,[1:3,end]), atts(:,[1:3,end]), 'mu');
t3 = err(:,end);
subplot(222), hold on, plot(t3, err(:,1:2)/glv.min); xygo('mu'); mylegend('mux','muy');
subplot(224), hold on, plot(t3, err(:,3)/glv.min); xygo('mu'); mylegend('muz');
%%%%%%%%%%%%%%%%%%%%%%%%%%%%%%%%%%%%%%%%%%%%%%%%%%%%%%%%%
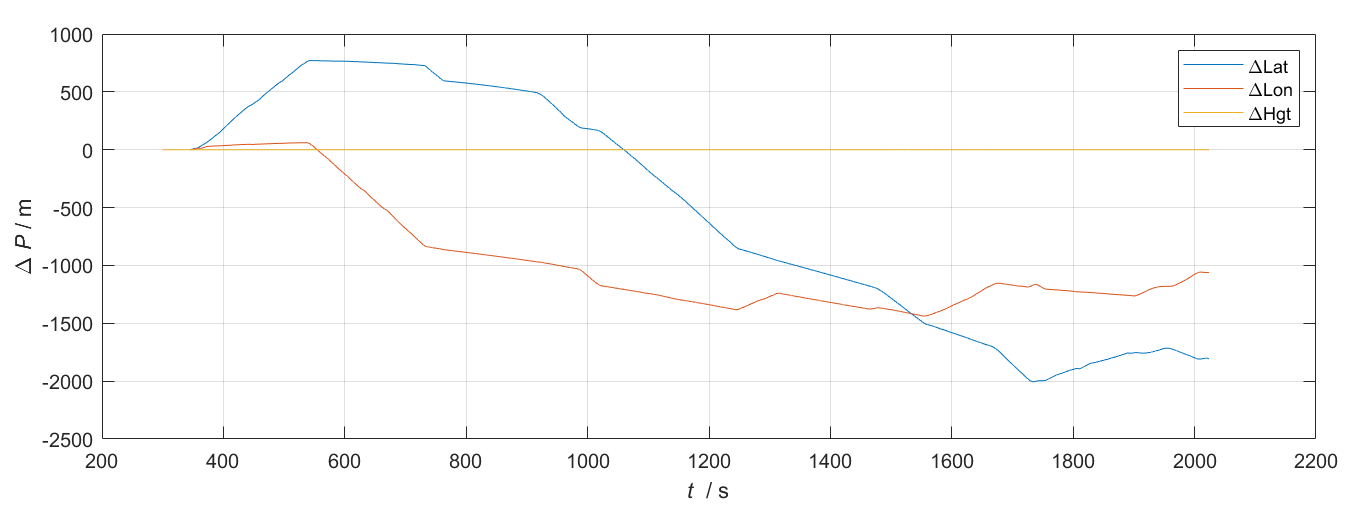
% error of velocity and position between pure ins and gps
t1 = gps(:,end);
t2 = avp(:,end);
vnS = gps(:,1:3); posS = gps(:,4:6);
dxyz = pos2dxyz(avp(:,7:9));
%%%%%%%%%
myfigure;
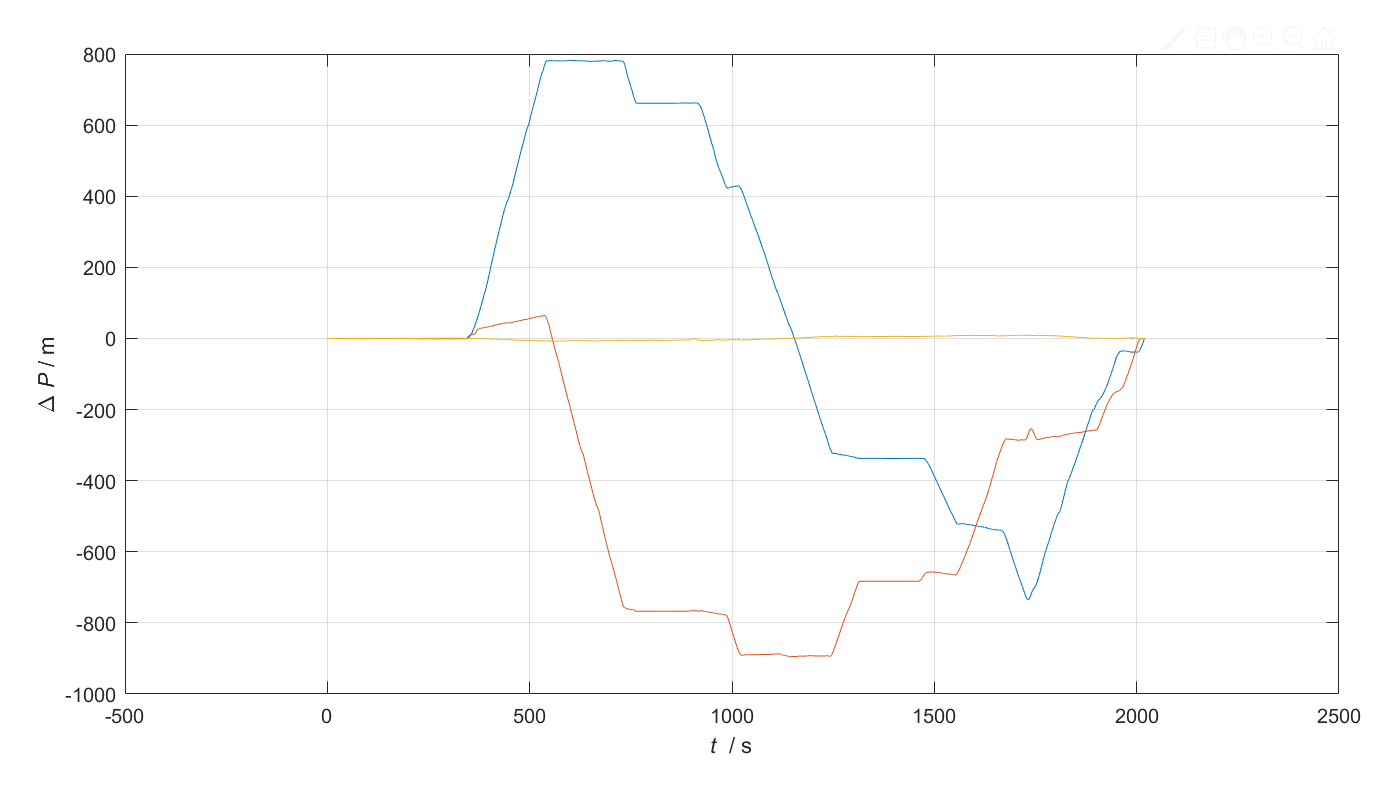
% pos
subplot(221), plot(t1, (posS(:,1)-posS(1,1))*glv.Re,'r-');
hold on, plot(t1, (posS(:,2)-posS(1,2))*cos(posS(1,1))*glv.Re,'g-');
hold on, plot(t1, posS(:,3)-posS(1,3),'b-');
hold on, plot(t2, dxyz(:,2),'r--'); xygo('DP');
hold on, plot(t2, dxyz(:,1),'g--');
hold on, plot(t2, dxyz(:,3),'b--');
legend('gps \Delta P_E','gps \Delta P_N','gps \Delta P_U','ins \Delta P_E','ins \Delta P_N','ins \Delta P_U');
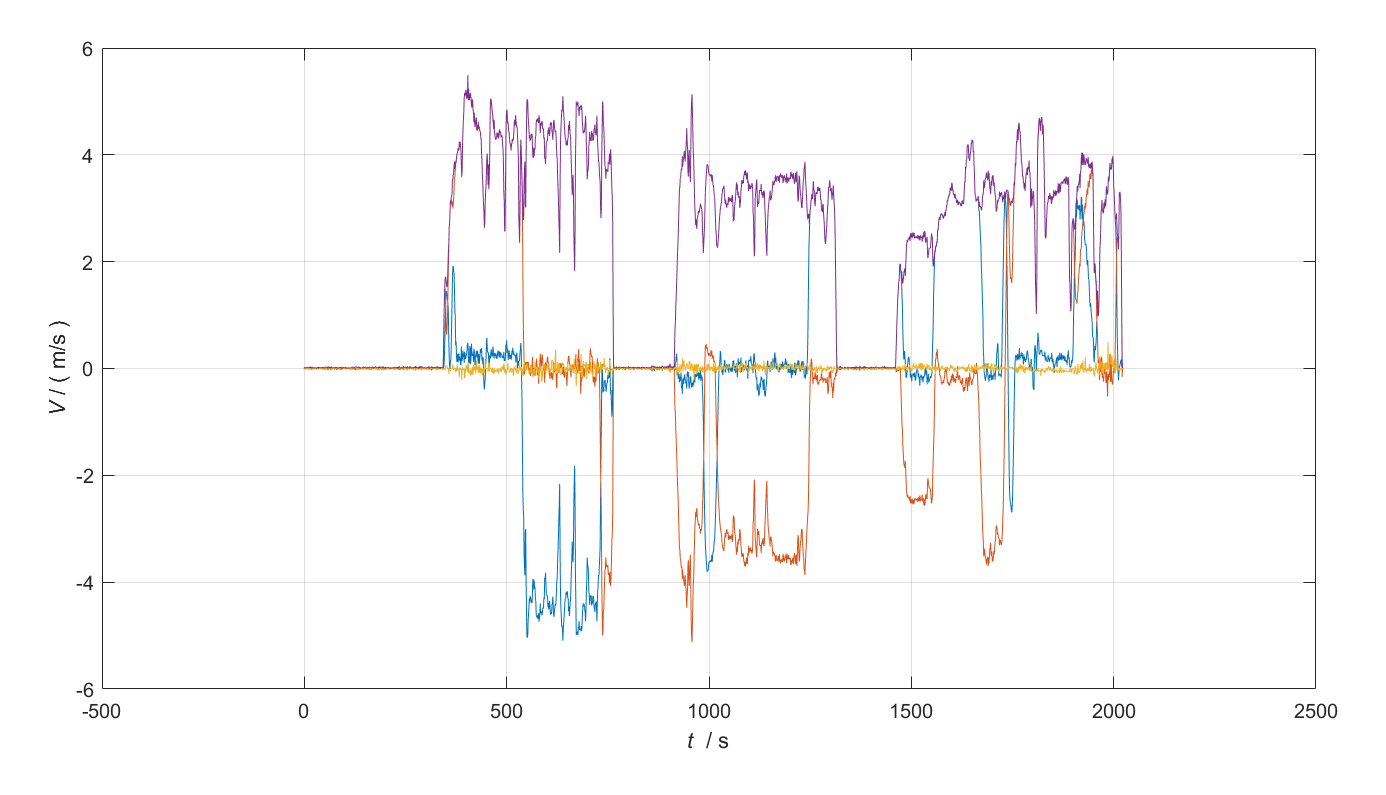
% V_E
subplot(222), plot(t1, vnS(:,1)); xygo('V');
hold on, plot(t2, avp(:,4));
legend('gps V_E','ins V_E');
% V_N
subplot(223), plot(t1, vnS(:,2)); xygo('V');
hold on, plot(t2, avp(:,5));
legend('gps V_N','ins V_N');
% V_U
subplot(224), plot(t1, vnS(:,3)); xygo('V');
hold on, plot(t2, avp(:,6));
legend('gps V_U','ins V_U');
激光惯导测量数据:
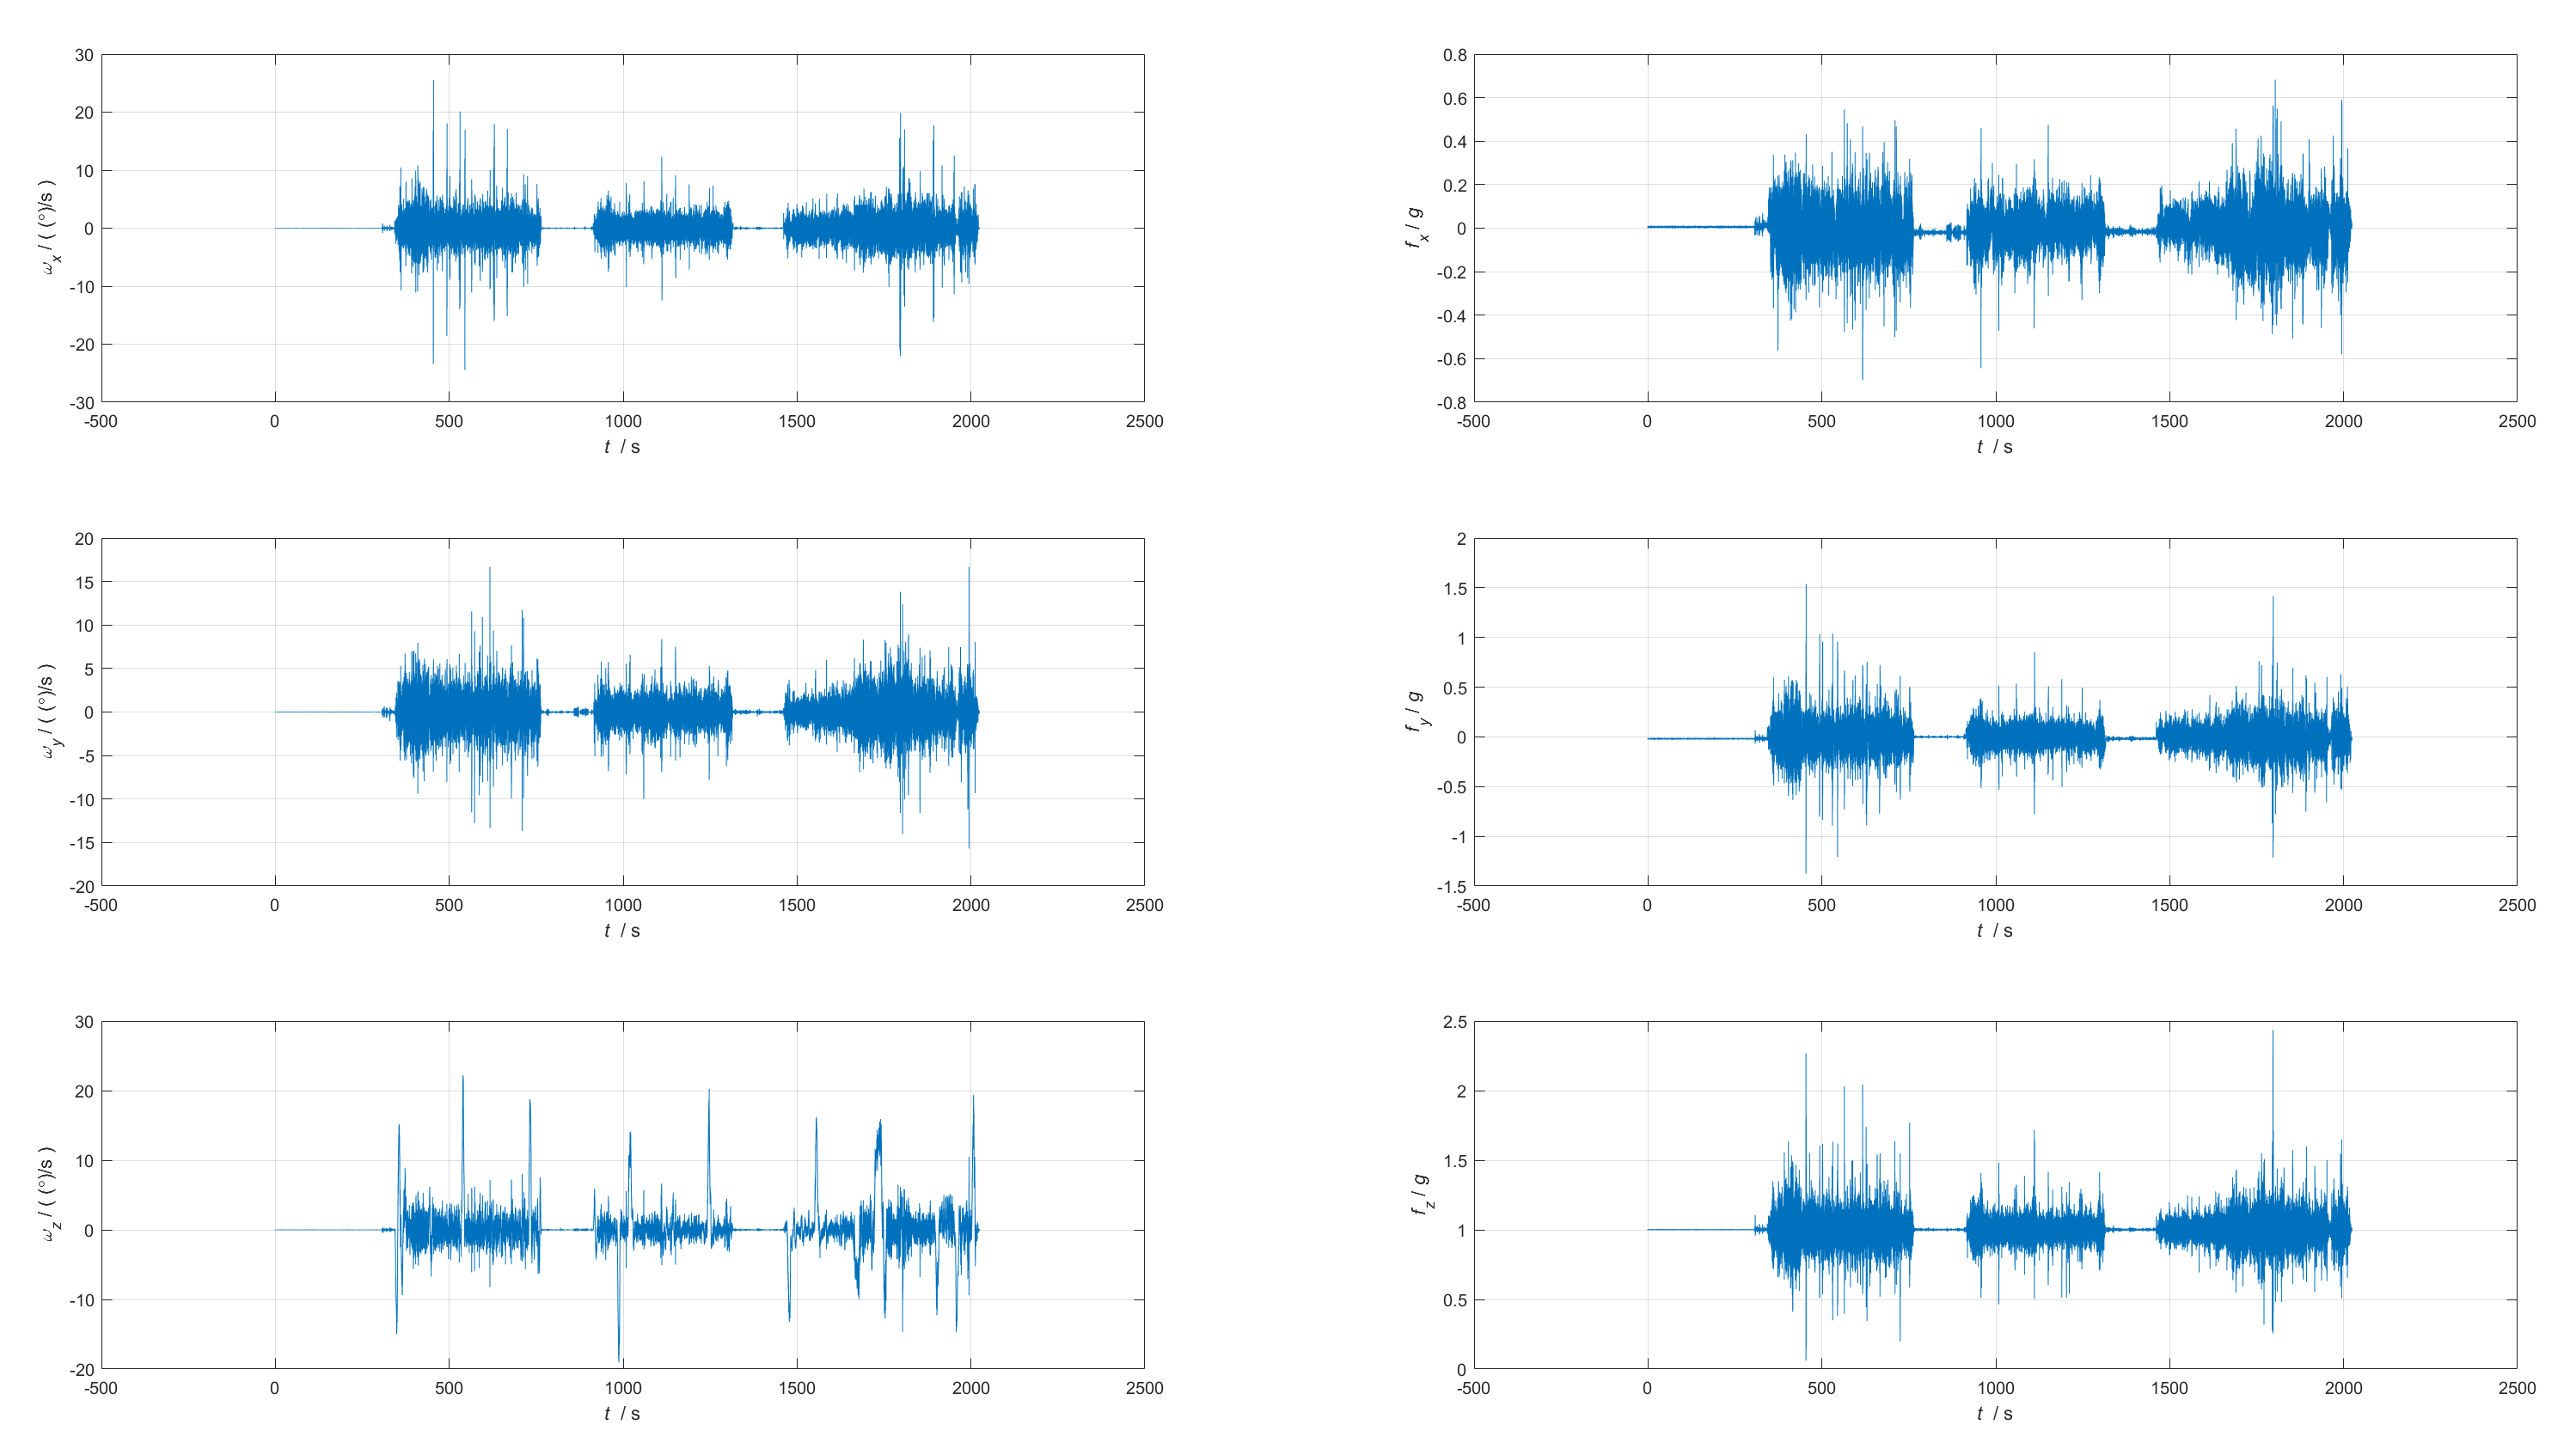
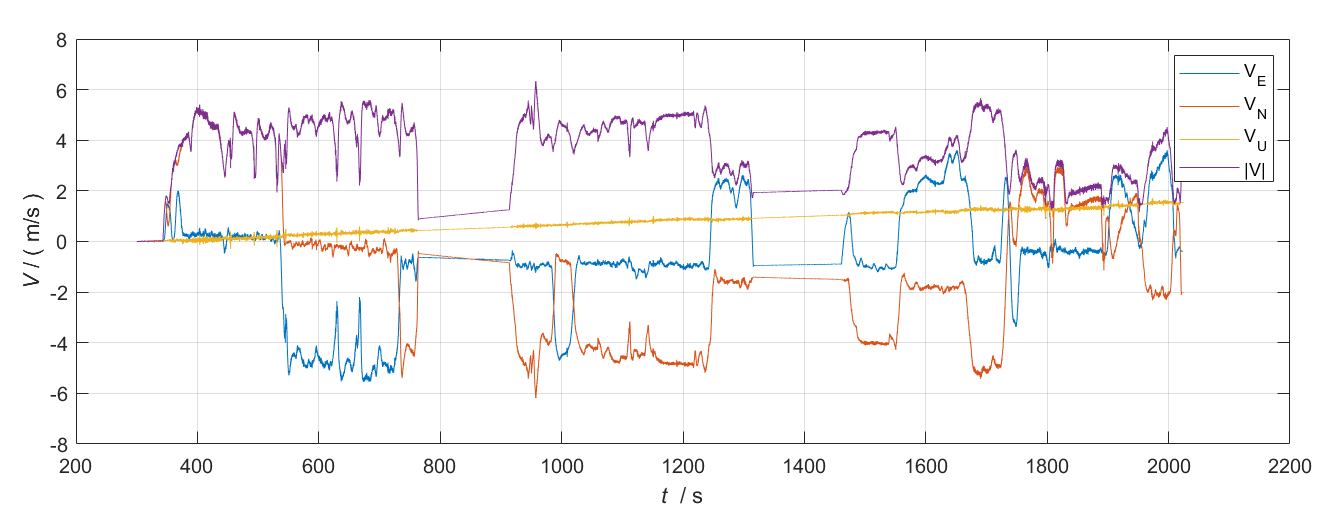
GPS输出:
初始对准:
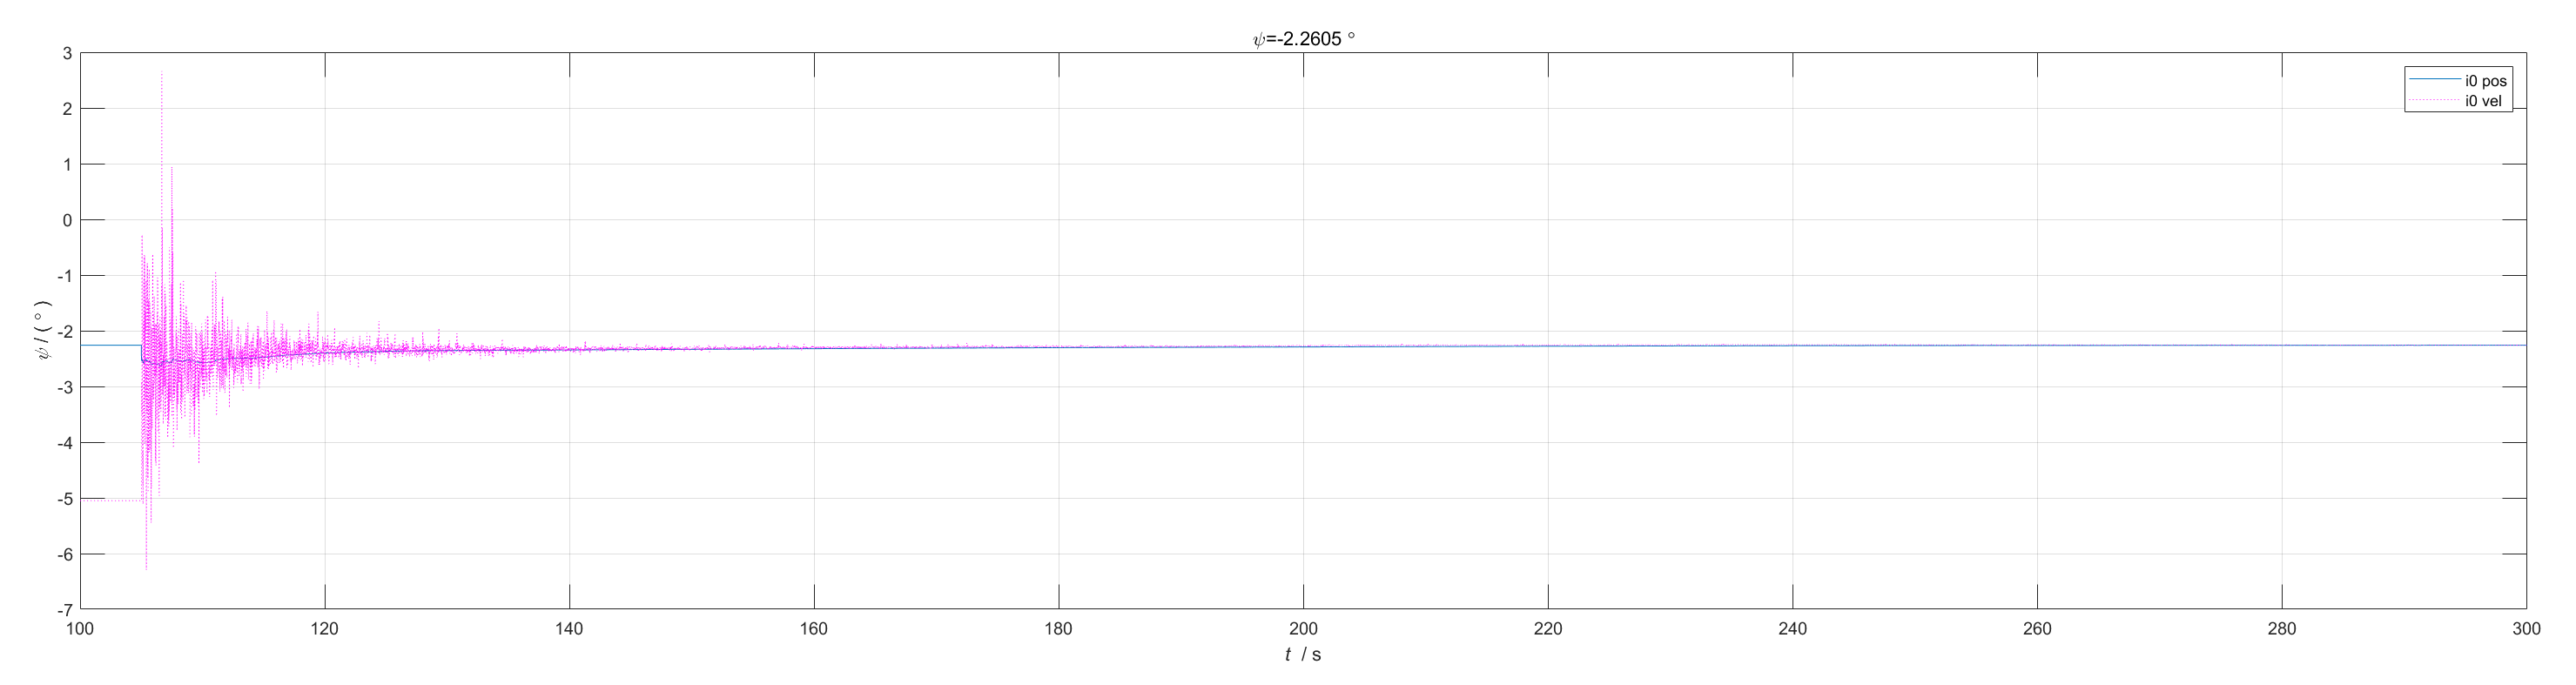
纯惯导结果:
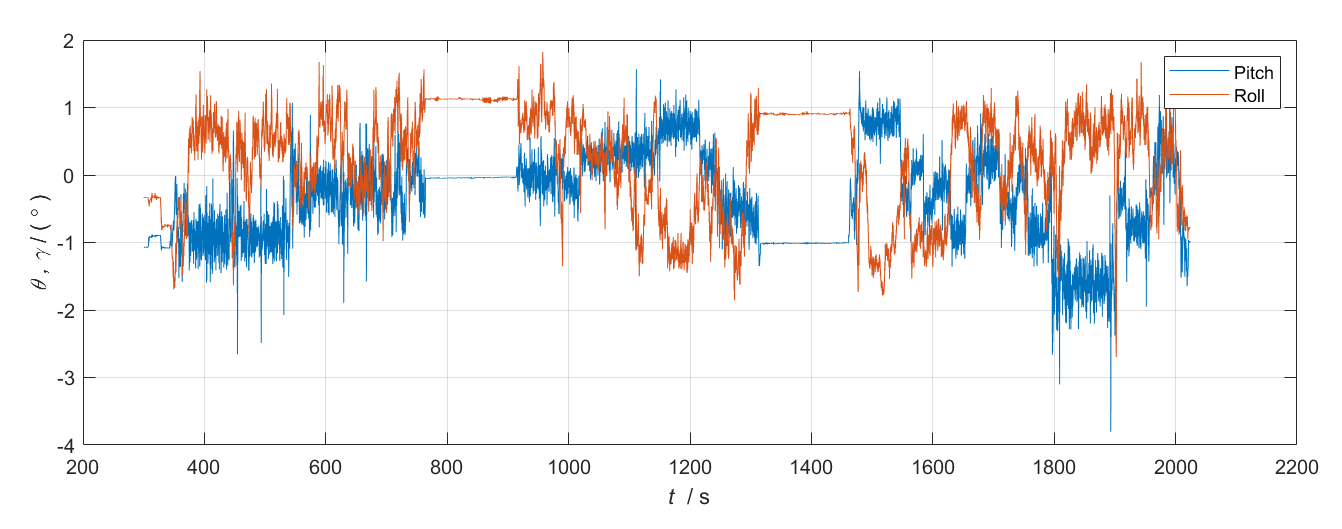
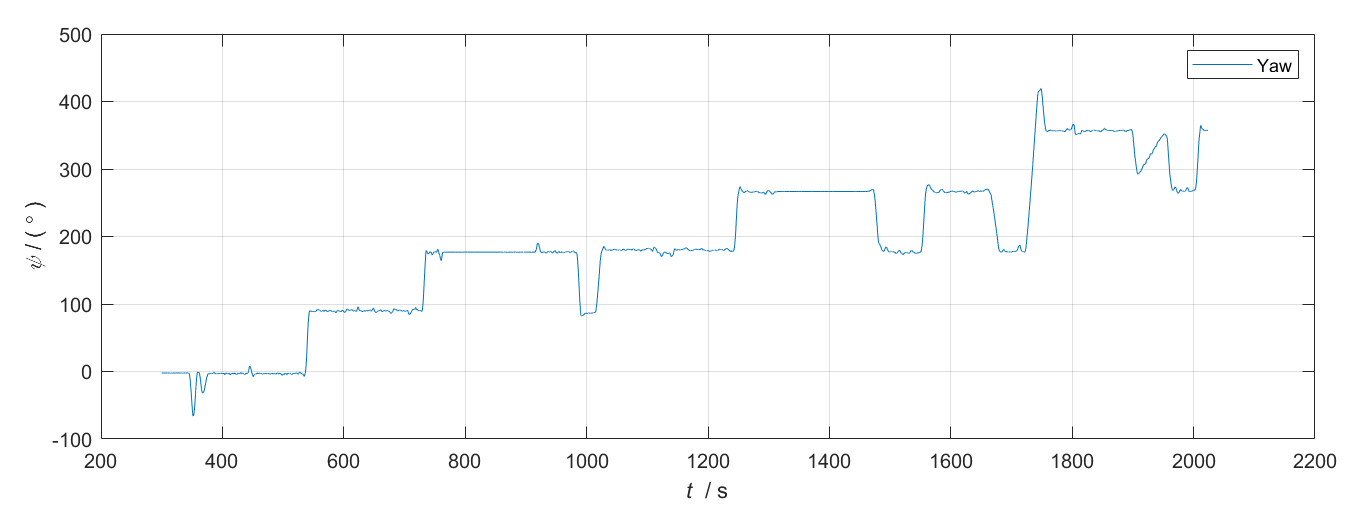
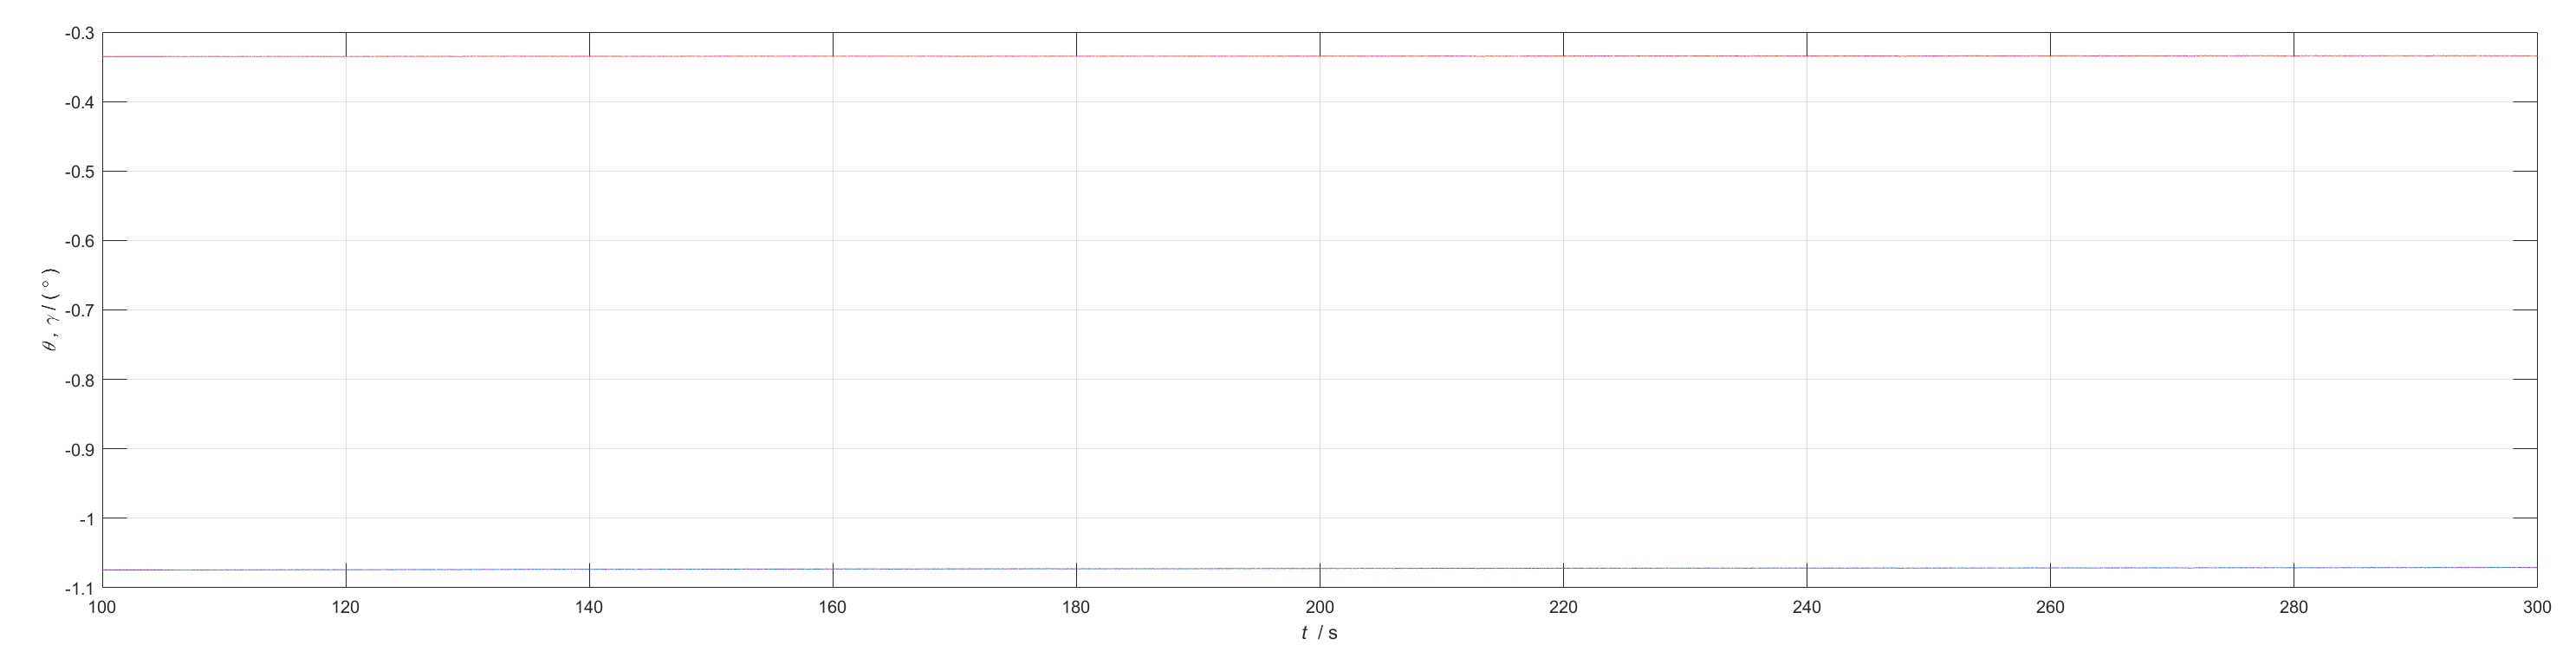
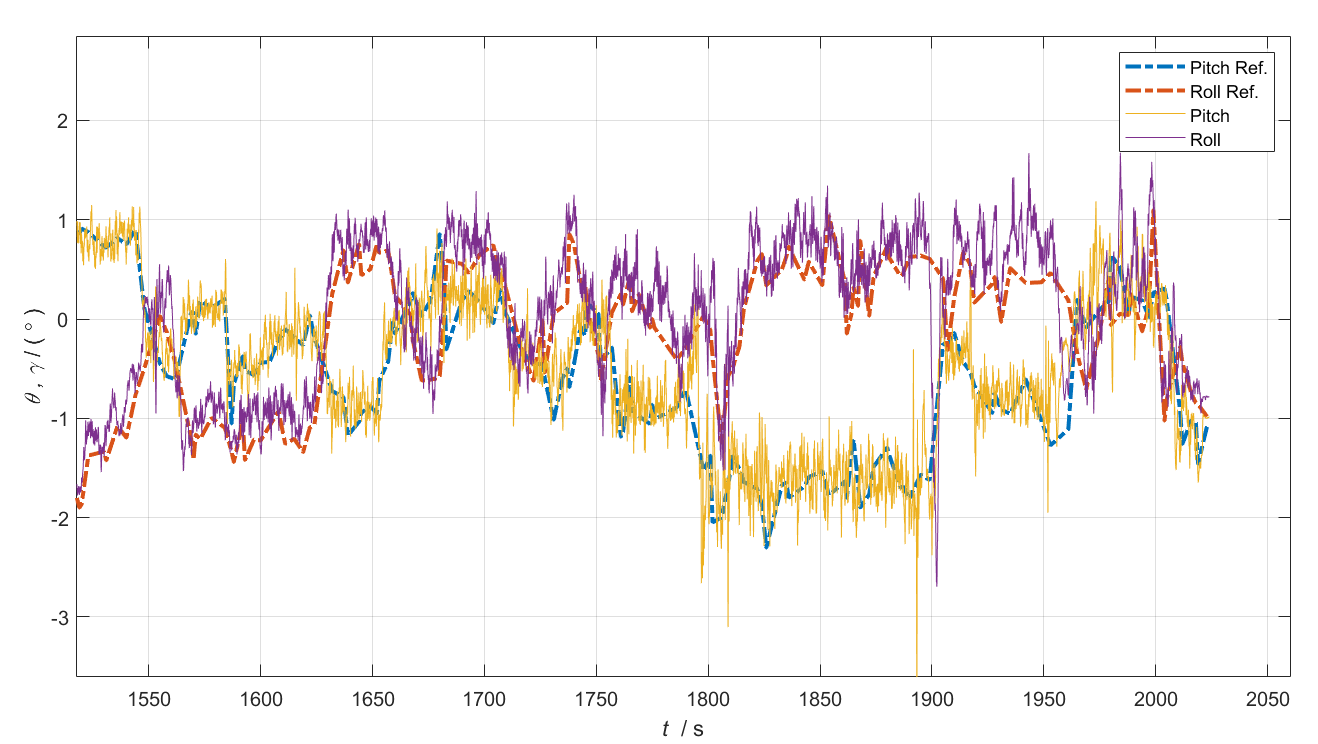
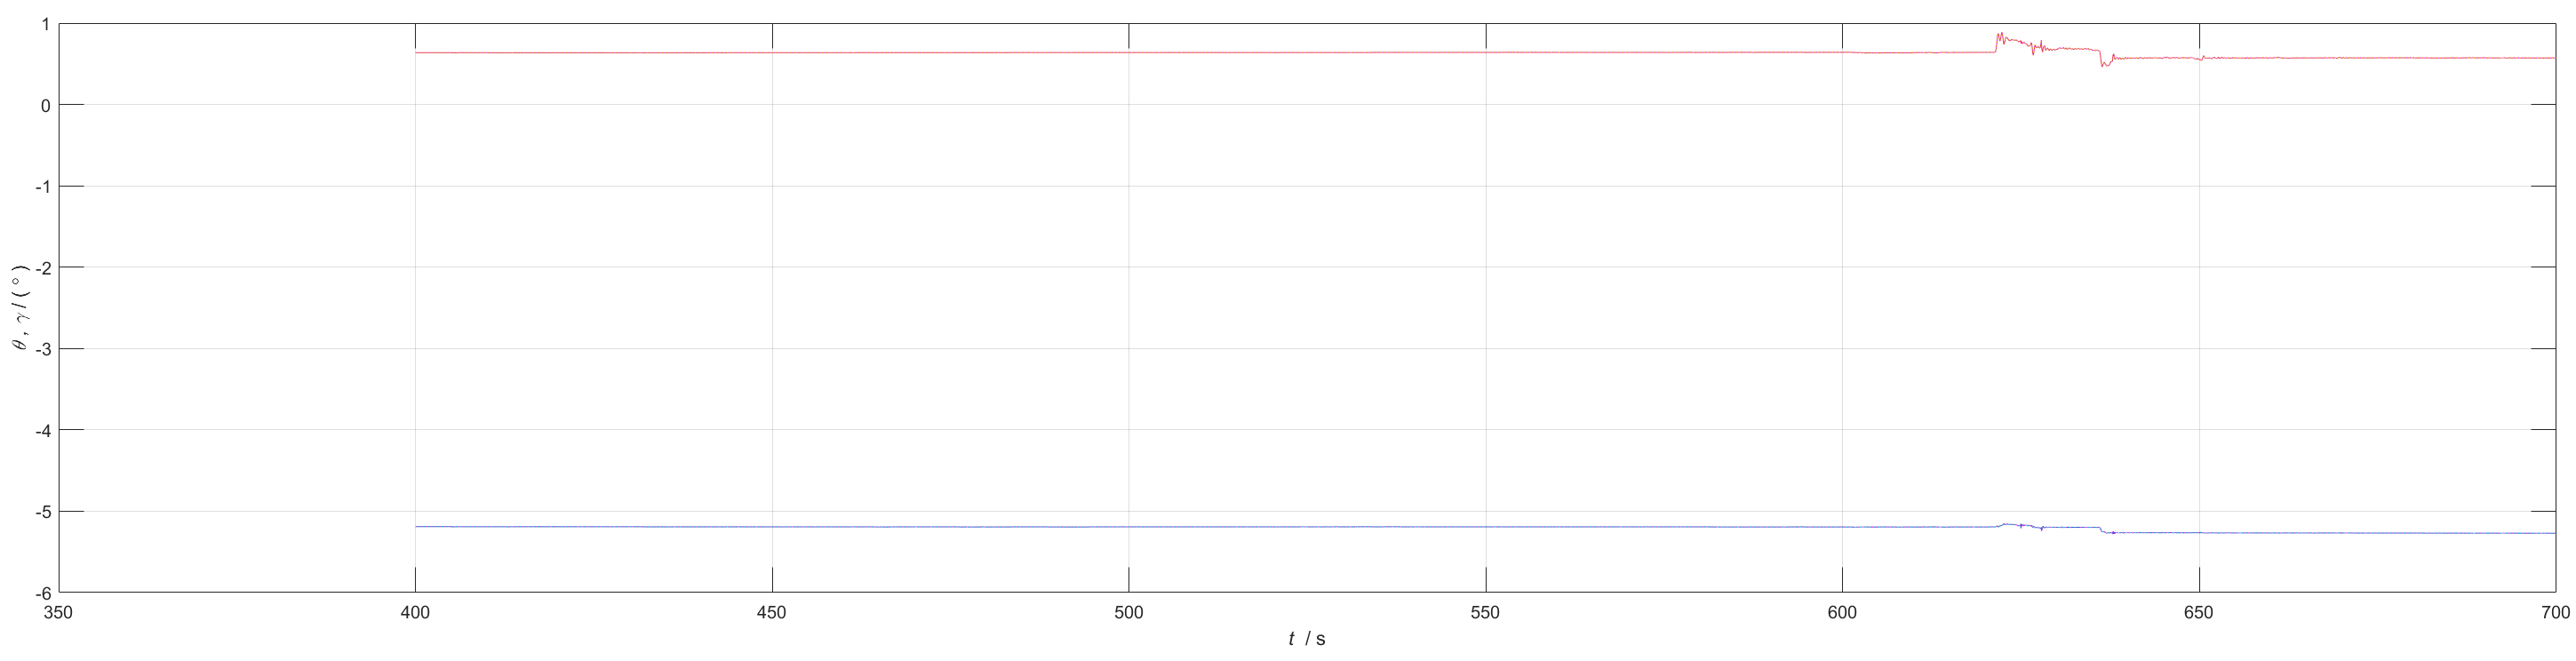
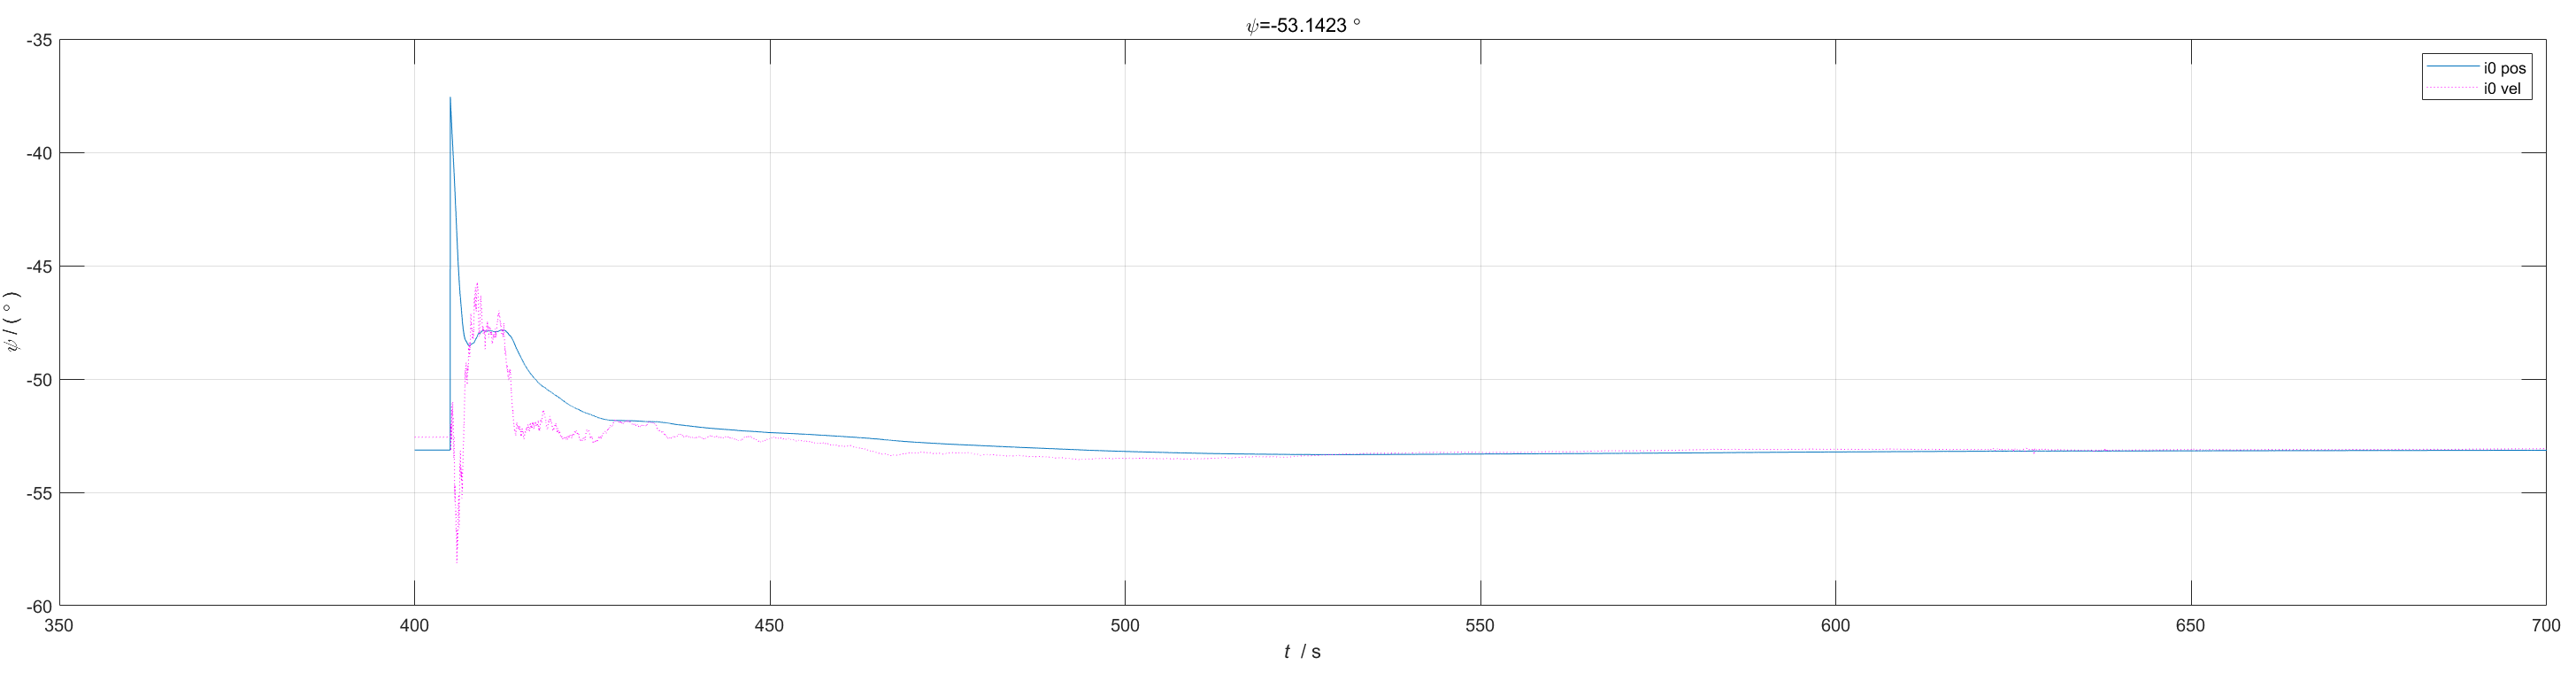
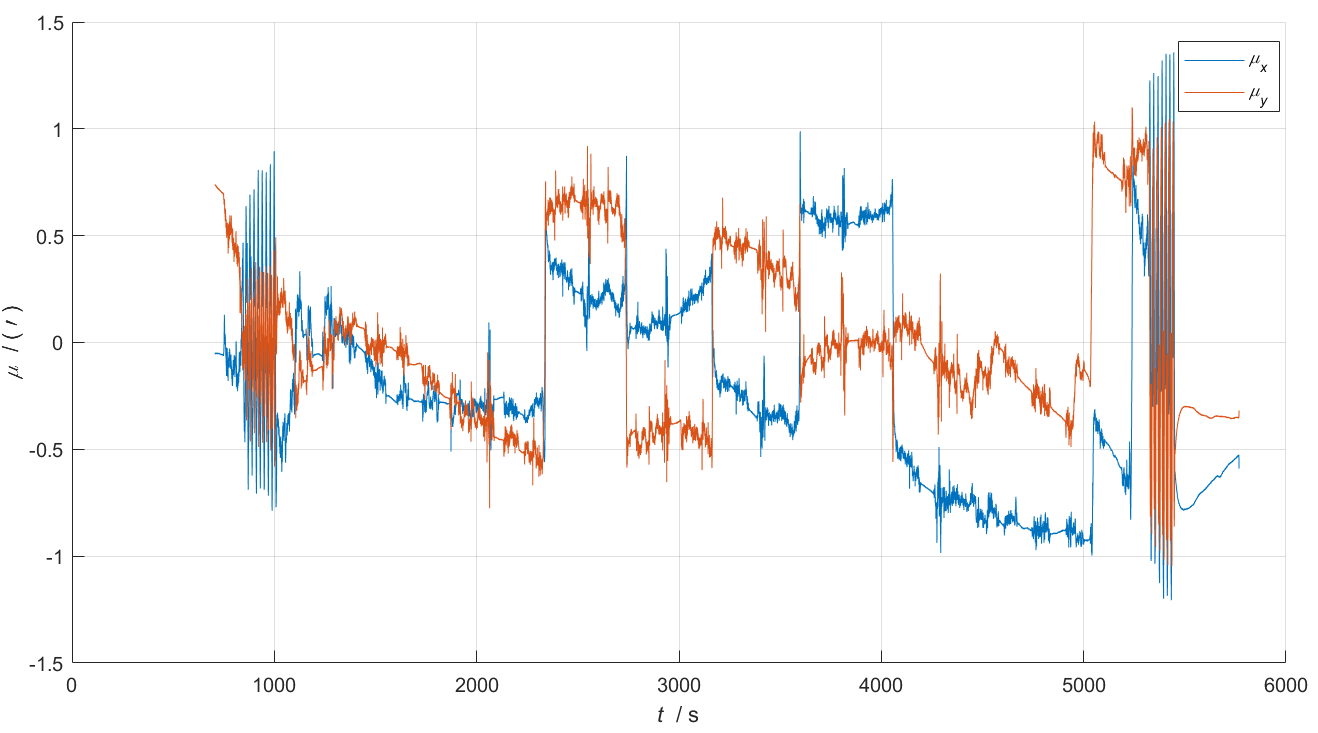
星敏姿态(转换至地理系)与惯导姿态的对比(角速率大时两者差值波动大,静态时两者差值较平稳):
俯仰角,横滚角:
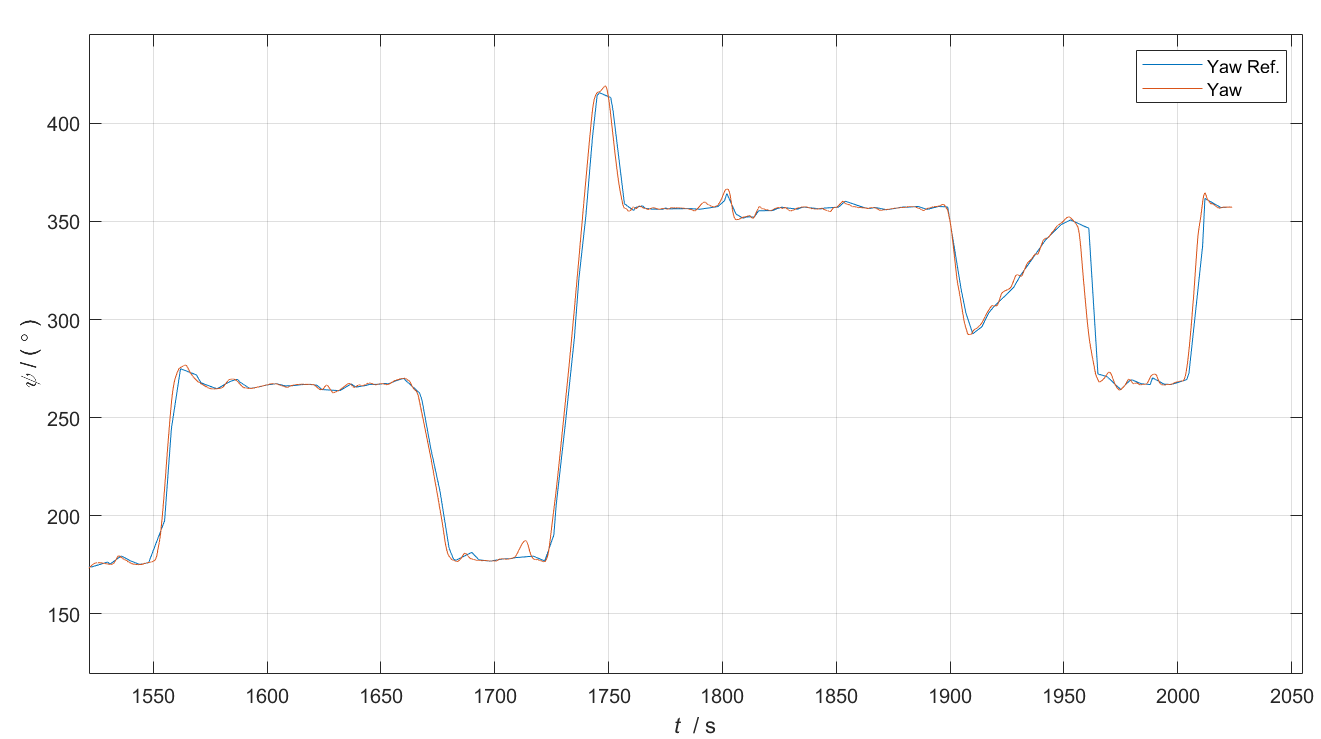
偏航角:
俯仰角,横滚角误差:
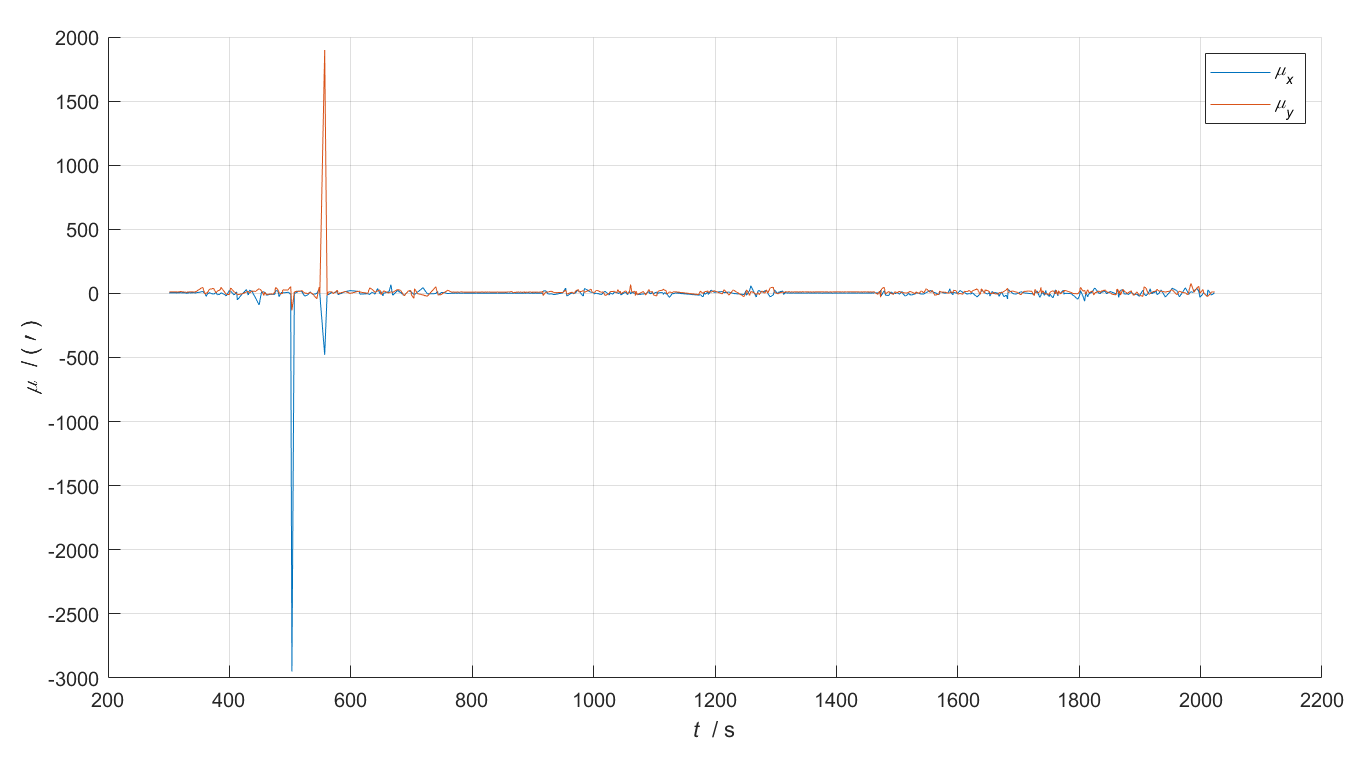
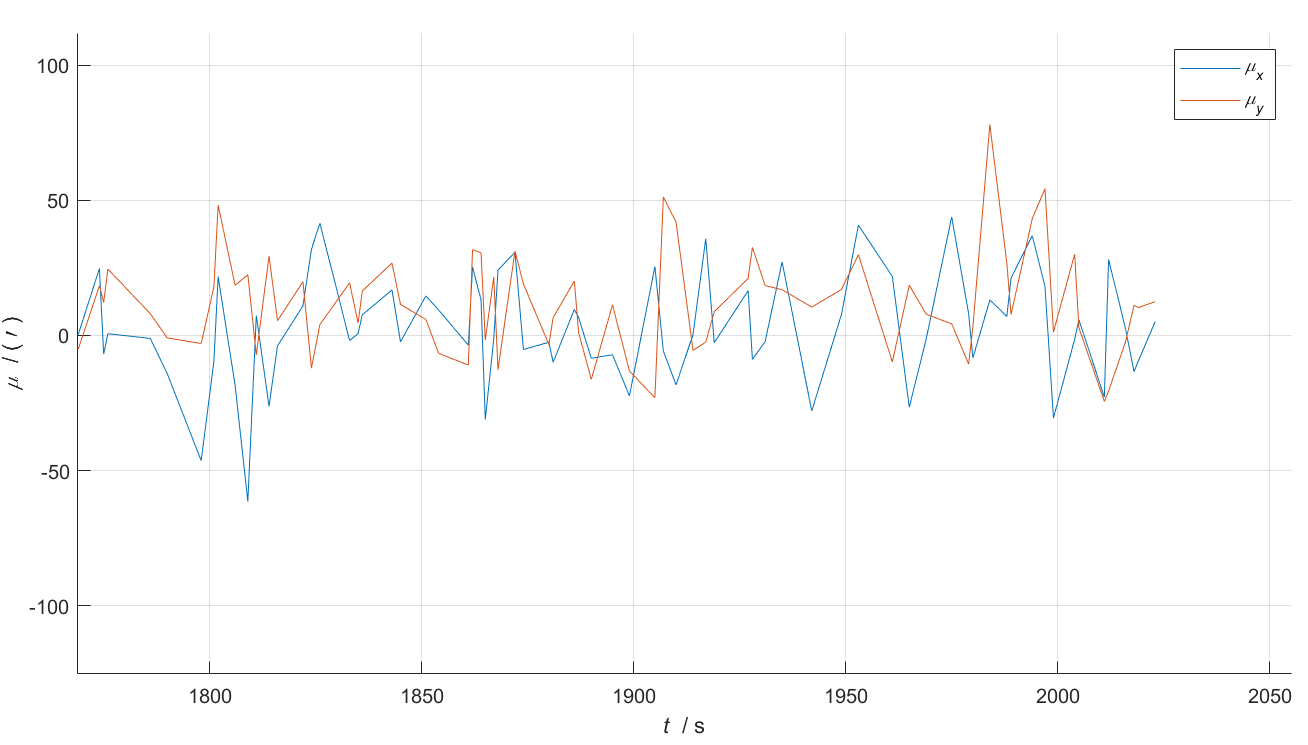
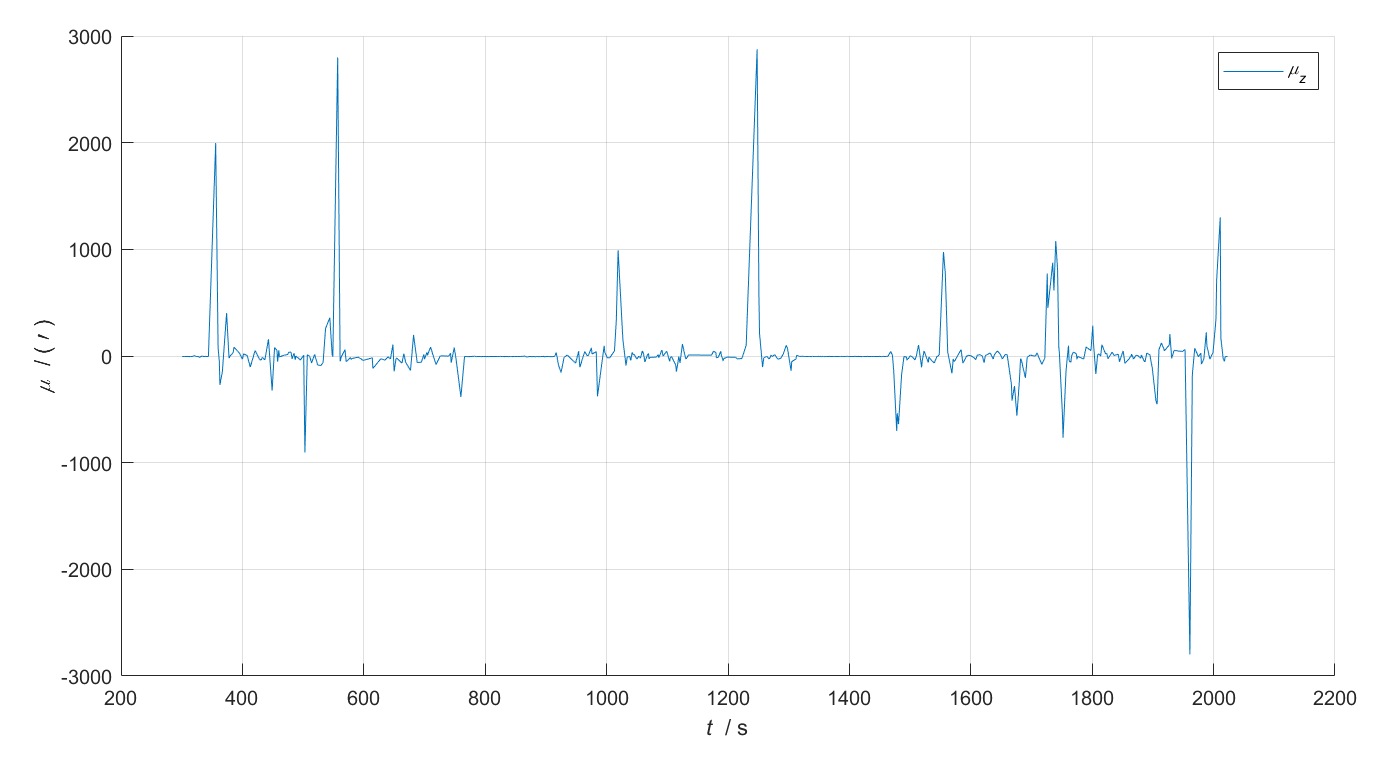
偏航角误差:
测试数据集2
一组MEMS/FOG/GPS跑车测试(由大连理工大学刘兵提供)
MEMS惯组为MTI710 工作在垂直陀螺模式下(含水平姿态输出),
MTi-710是高性能 AHRS。MTi-710 具有精确捕捉高频动态姿态的能力,有航向稳定功能。
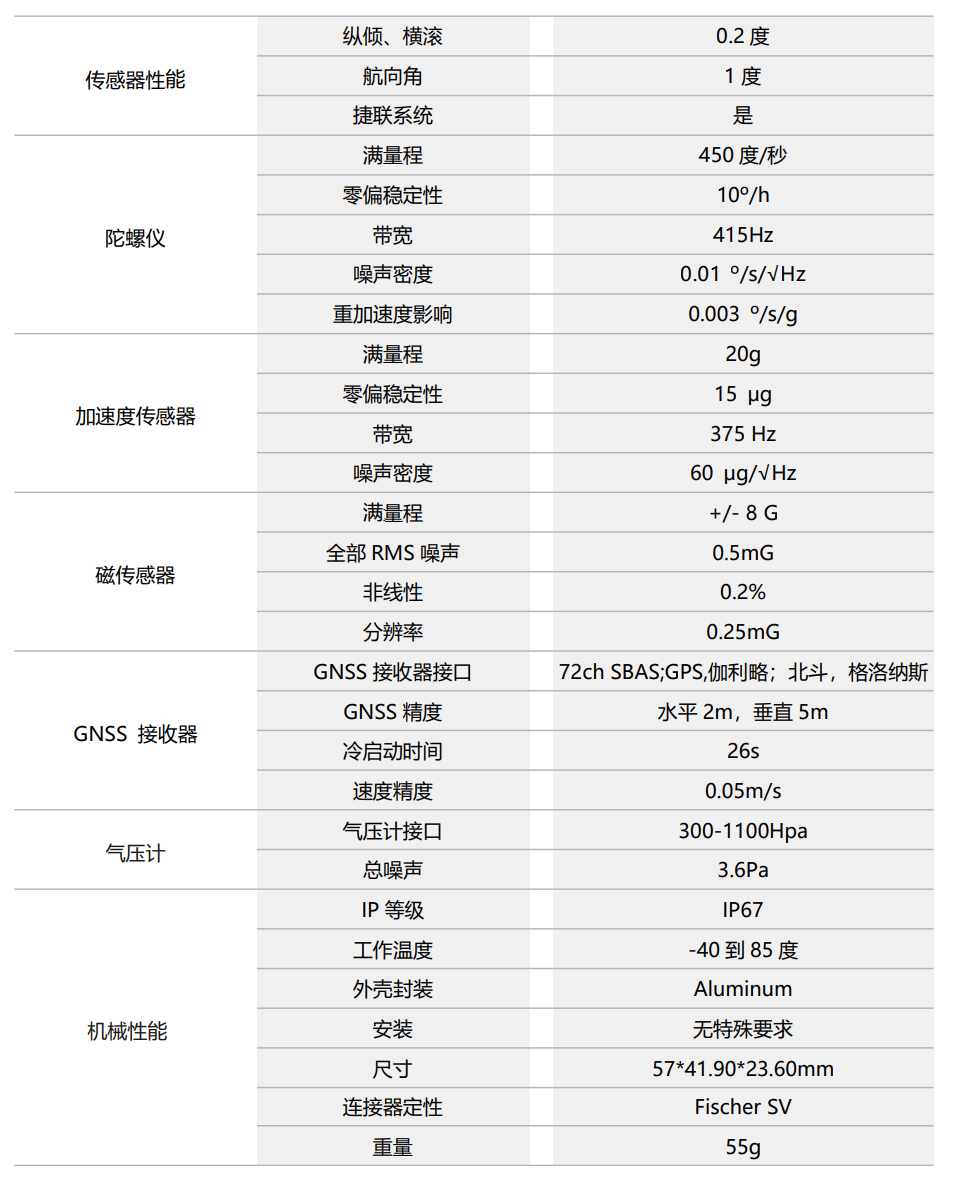
FOG惯组为惯性级别,两IMU采样频率均为100Hz;
GPS采用差分,输出频率5Hz。
先静止730s,再跑车约3小时,车速较慢约3.5m/s,
行车范围约方圆10km内,外行再返回。
利用Matlab/PSINS Toolbox进行数据加载和一些简单测试程序如下:
glvs;
ts = 1/100;
t1 = 700; t2 = 1300;
load lb_memsfoggps;
imuplot(imuFOG); imuplot(imuMTI); gpsplot(gps); insplot(attMTI, 'a');
att0 = aligni0(imuFOG(400/ts:t1/ts,:), gps(1,4:6)');
avp = inspure(imuFOG(t1/ts:1700/ts,:), [att0; getat(gps,t1)], 'H');
avpcmpplot(avp(:,[1:3,end]), datacut(attMTI,700,1700), 'a', 'datt');

avp0 = [att0; getat(gps,t1)];
ins = insinit(avp0, ts);
avperr = avperrset([10*60;30*60], 10, 100);
imuerr = imuerrset(1000, 10000, 0.1, 100);
Pmin = [avperrset([0.5,2],0.01,0.01); gabias(1, [100,100]); [0.01;0.01;0.01]; 0.01].^2;
Rmin = vperrset(0.1, 0.1).^2;
[avp1, xkpk1, zkrk1, sk] = sinsgps(imuMTI(t1/ts:t2/ts,:), gps, ins, avperr, imuerr, rep3(1), 0.1, vperrset(1,10), Pmin, Rmin, 'avped');
avpcmpplot(avp, avp1, 'avp', 'mu');
avpcmpplot(gps, avp1, 'vp');
%% MEMS/FOG/GPS
close all;clear;
glvs;
ts = 1/100;
t1 = 700; t2 = 10800;
load lb_memsfoggps;
% imuplot(imuFOG); imuplot(imuMTI); gpsplot(gps); insplot(attMTI, 'a');
att0 = aligni0(imuFOG(400/ts:t1/ts,:), gps(1,4:6)');
avp = inspure(imuFOG(t1/ts:t2/ts,:), [att0; getat(gps,t1)], 'H');
avpcmpplot(avp(:,[1:3,end]), datacut(attMTI,t1,t2), 'a', 'datt');
%%%%%%%%%%%%%%%%%%%%%%%%%%%%%%%%%%%%%%%%%%%%%%%%%%%%%%%
% error of pitch and roll between pure ins and MTi-710 AHRS
myfigure;
atts=datacut(attMTI,t1,t2);
t11 = atts(:,end);
t22 = avp(:,end);
subplot(221), plot(t11, atts(:,1:2)/glv.deg,'-.','LineWidth',2), xygo('pr');
hold on, plot(t22, avp(:,1:2)/glv.deg), xygo('pr'); %legend('Pitch','Roll');
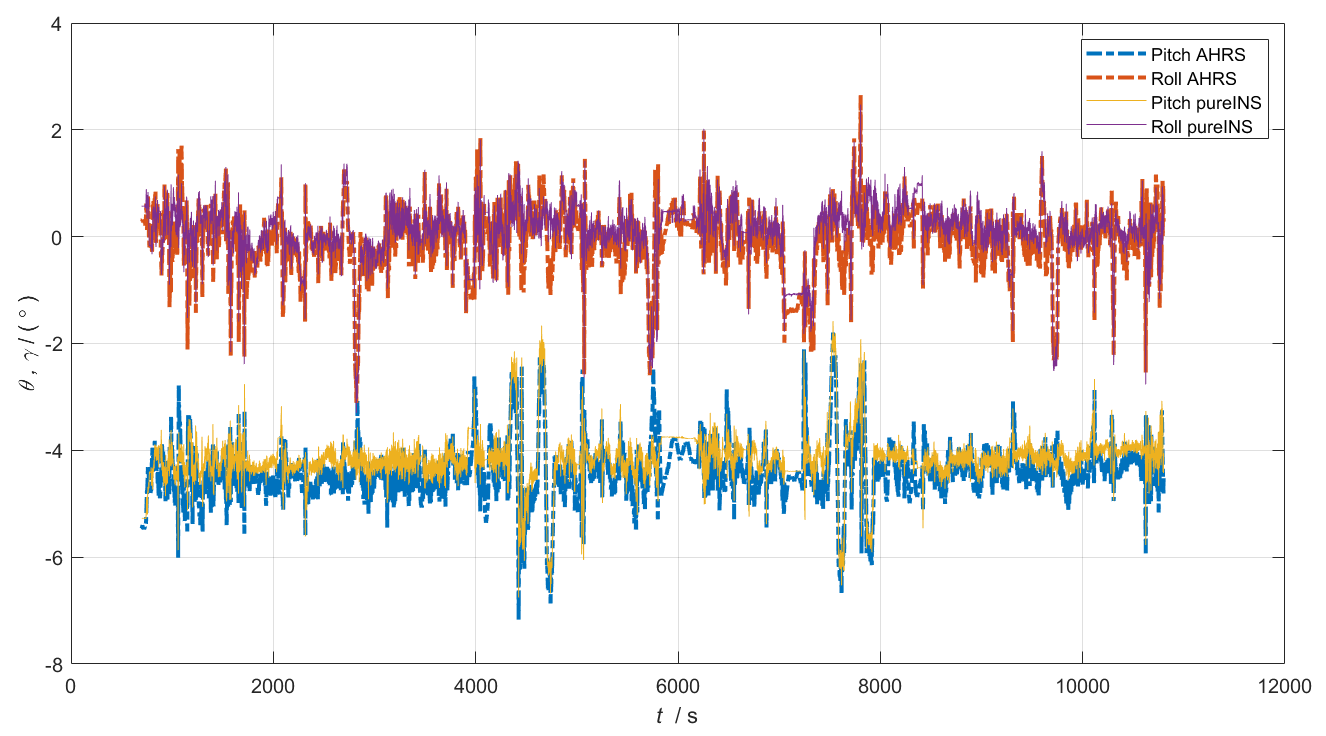
legend('Pitch AHRS', 'Roll AHRS', 'Pitch pureINS', 'Roll pureINS');
err = avpcmp(avp(:,[1:3,end]), atts(:,[1:3,end]), 'datt');
t3 = err(:,end);
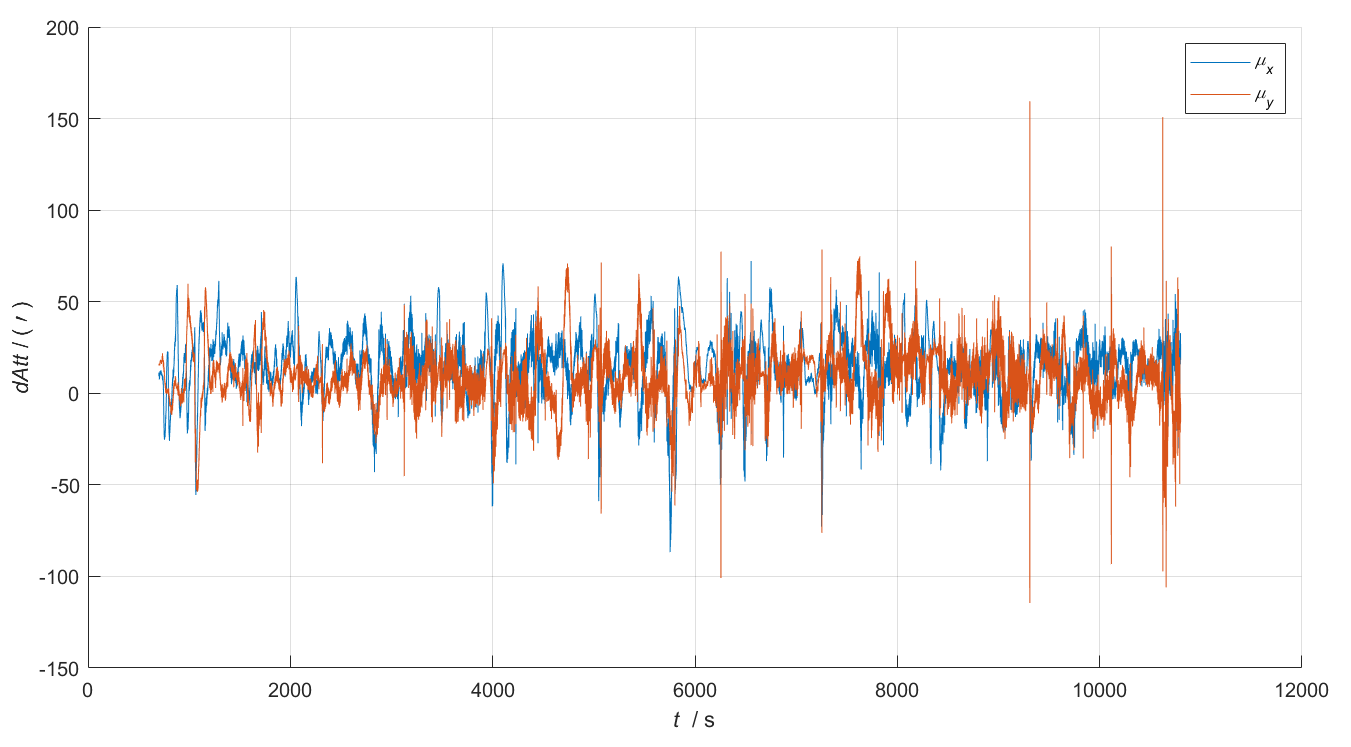
subplot(222), hold on, plot(t3, err(:,1:2)/glv.min); xygo('datt'); mylegend('mux','muy');
%%%%%%%%%%%%%%%%%%%%%%%%%%%%%%%%%%%%%%%%%%%%%%%%%%%%%%%
% integrated navigation
avp0 = [att0; getat(gps,t1)];
ins = insinit(avp0, ts);
avperr = avperrset([10*60;30*60], 10, 100);
imuerr = imuerrset(1000, 10000, 0.1, 100);
Pmin = [avperrset([0.5,2],0.01,0.01); gabias(1, [100,100]); [0.01;0.01;0.01]; 0.01].^2;
Rmin = vperrset(0.1, 0.1).^2;
[avp1, xkpk1, zkrk1, sk] = sinsgps(imuMTI(t1/ts:t2/ts,:), gps, ins, avperr, imuerr, rep3(1), 0.1, vperrset(1,10), Pmin, Rmin, 'avped');
%%%%%%%%%%%%%%%%%%%%%%%%%%%%%%%%%%%%%%%%%%%%%%%%%%%%%%%
% compare pure ins and integrated navigation
avpcmpplot(avp1, avp, 'avp', 'mu');
% error of pitch and roll between pure ins and integrated navigation
myfigure;
t11 = avp1(:,end);
t22 = avp(:,end);
subplot(221), plot(t11, avp1(:,1:2)/glv.deg,'-.','LineWidth',2), xygo('pr');
hold on, plot(t22, avp(:,1:2)/glv.deg), xygo('pr'); %legend('Pitch','Roll');
legend('Pitch INS&GPS', 'Roll INS&GPS', 'Pitch pureINS', 'Roll pureINS');
subplot(223), plot(t11, yawplot(avp1(:,3)/glv.deg),'-.','LineWidth',2), xygo('y');
hold on, plot(t22, yawplot(avp(:,3)/glv.deg)), xygo('y'); %legend('Yaw');
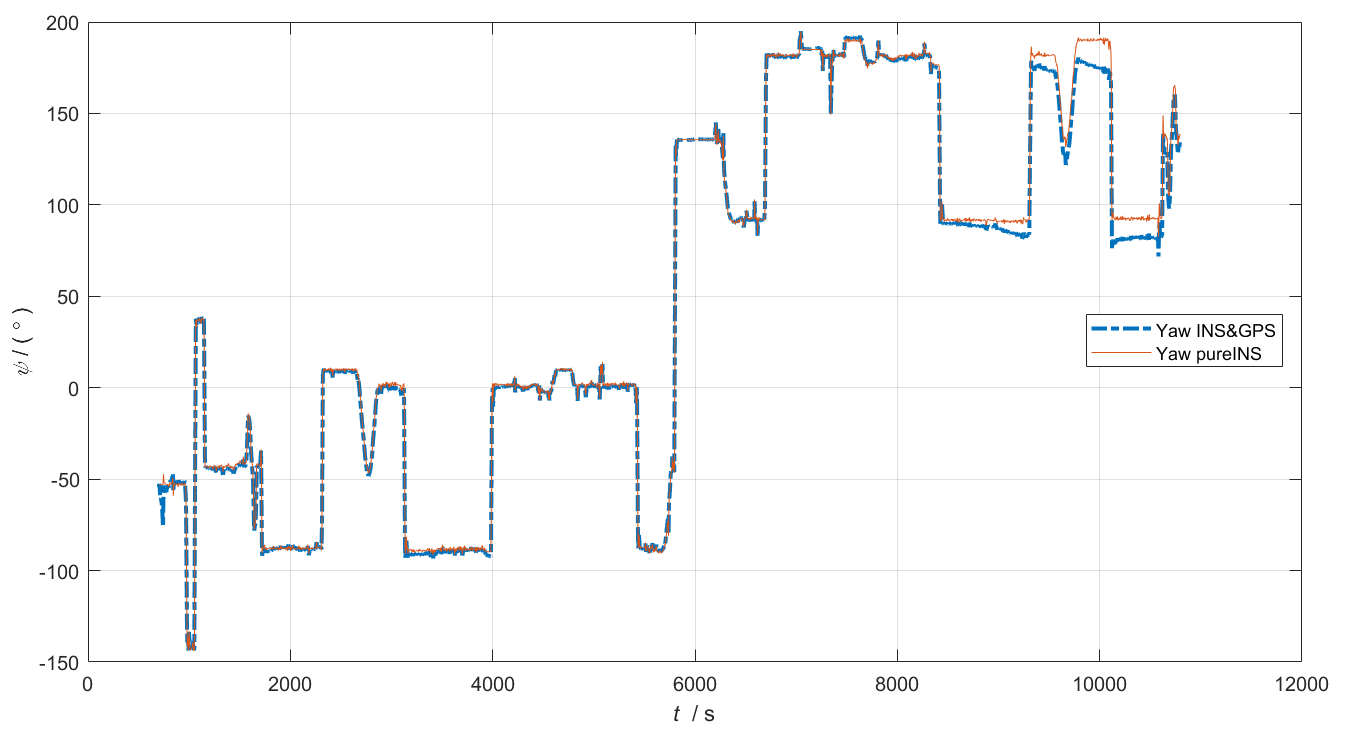
legend('Yaw INS&GPS', 'Yaw pureINS');
err = avpcmp(avp(:,[1:3,end]), avp1(:,[1:3,end]), 'datt');
t33 = err(:,end);
subplot(222), hold on, plot(t33, err(:,1:2)/glv.min); xygo('datt'); mylegend('mux','muy');
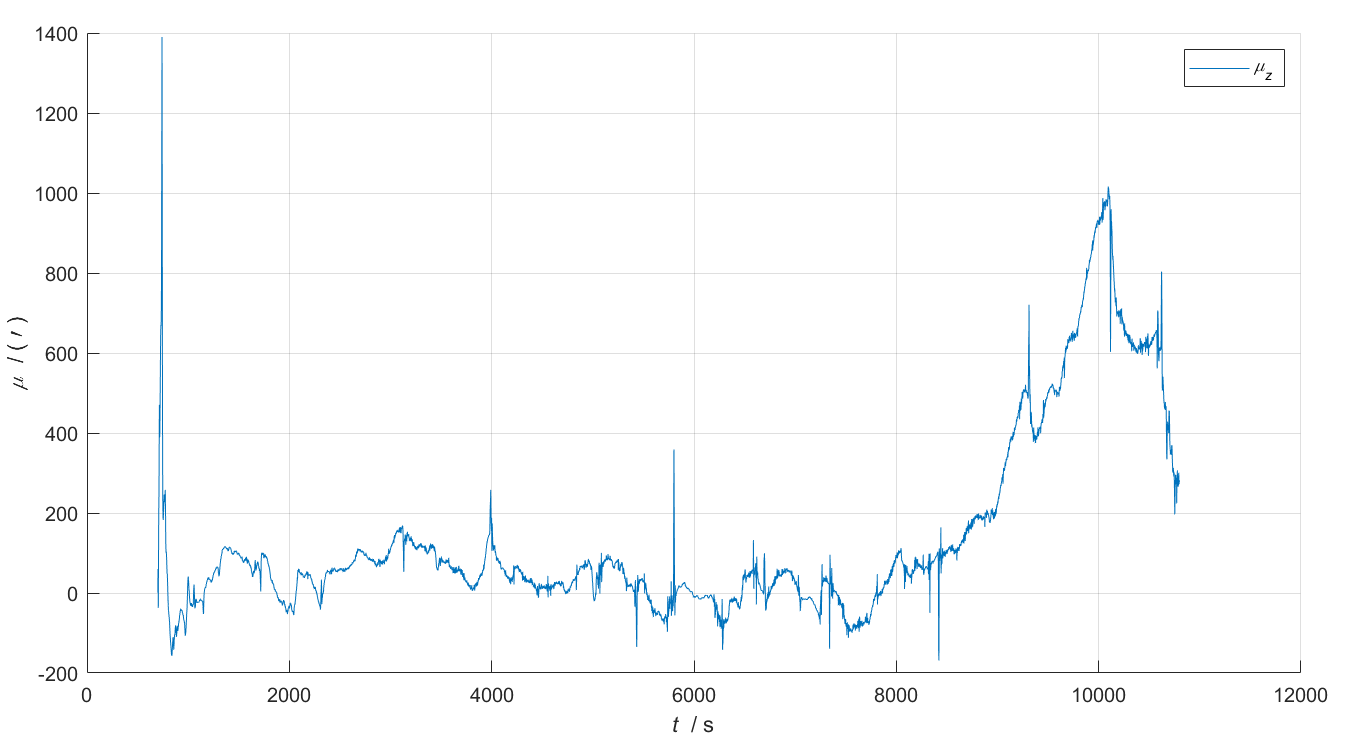
subplot(224), hold on, plot(t33, err(:,3)/glv.min); xygo('mu'); mylegend('muz');
光纤惯导初始对准(400-700s)
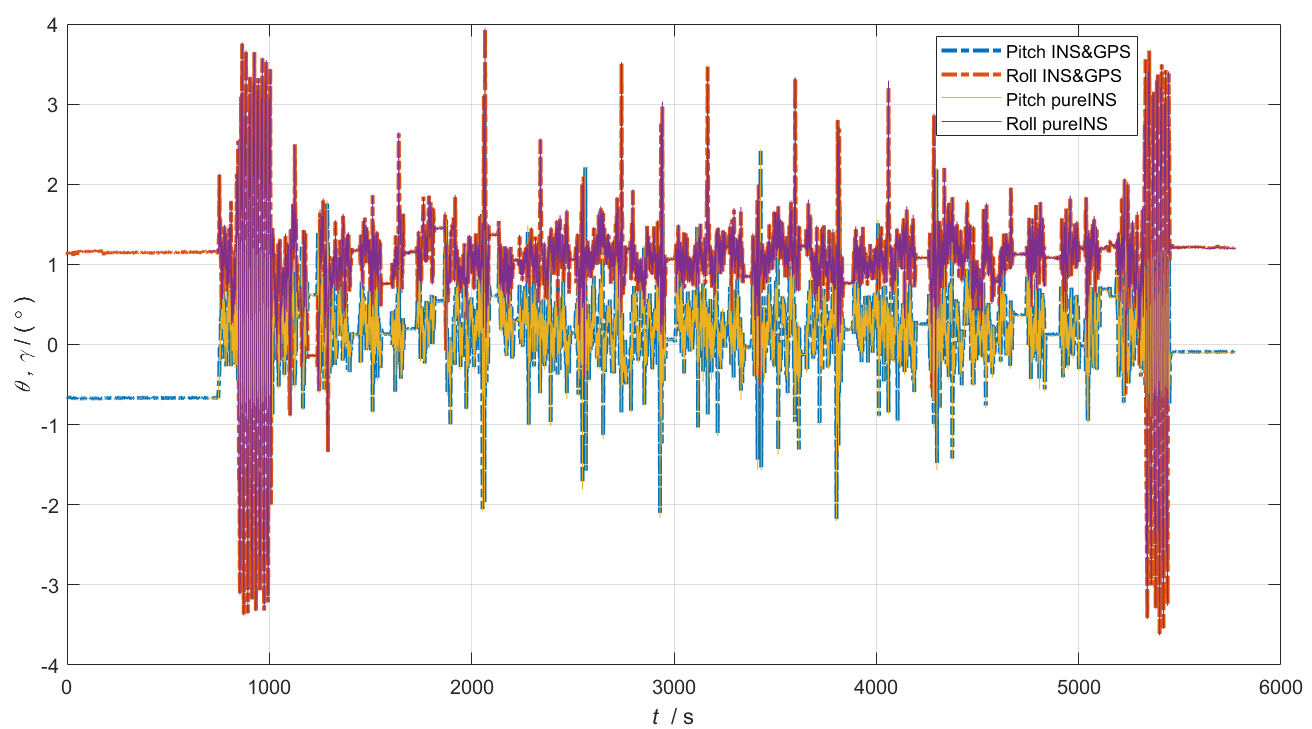
光纤纯惯性导航(700-1700s)
光纤纯惯导与组合导航姿态结果对比
2.5h以内航向角保持2deg以内偏差
2.5h之后开始有明显误差累积
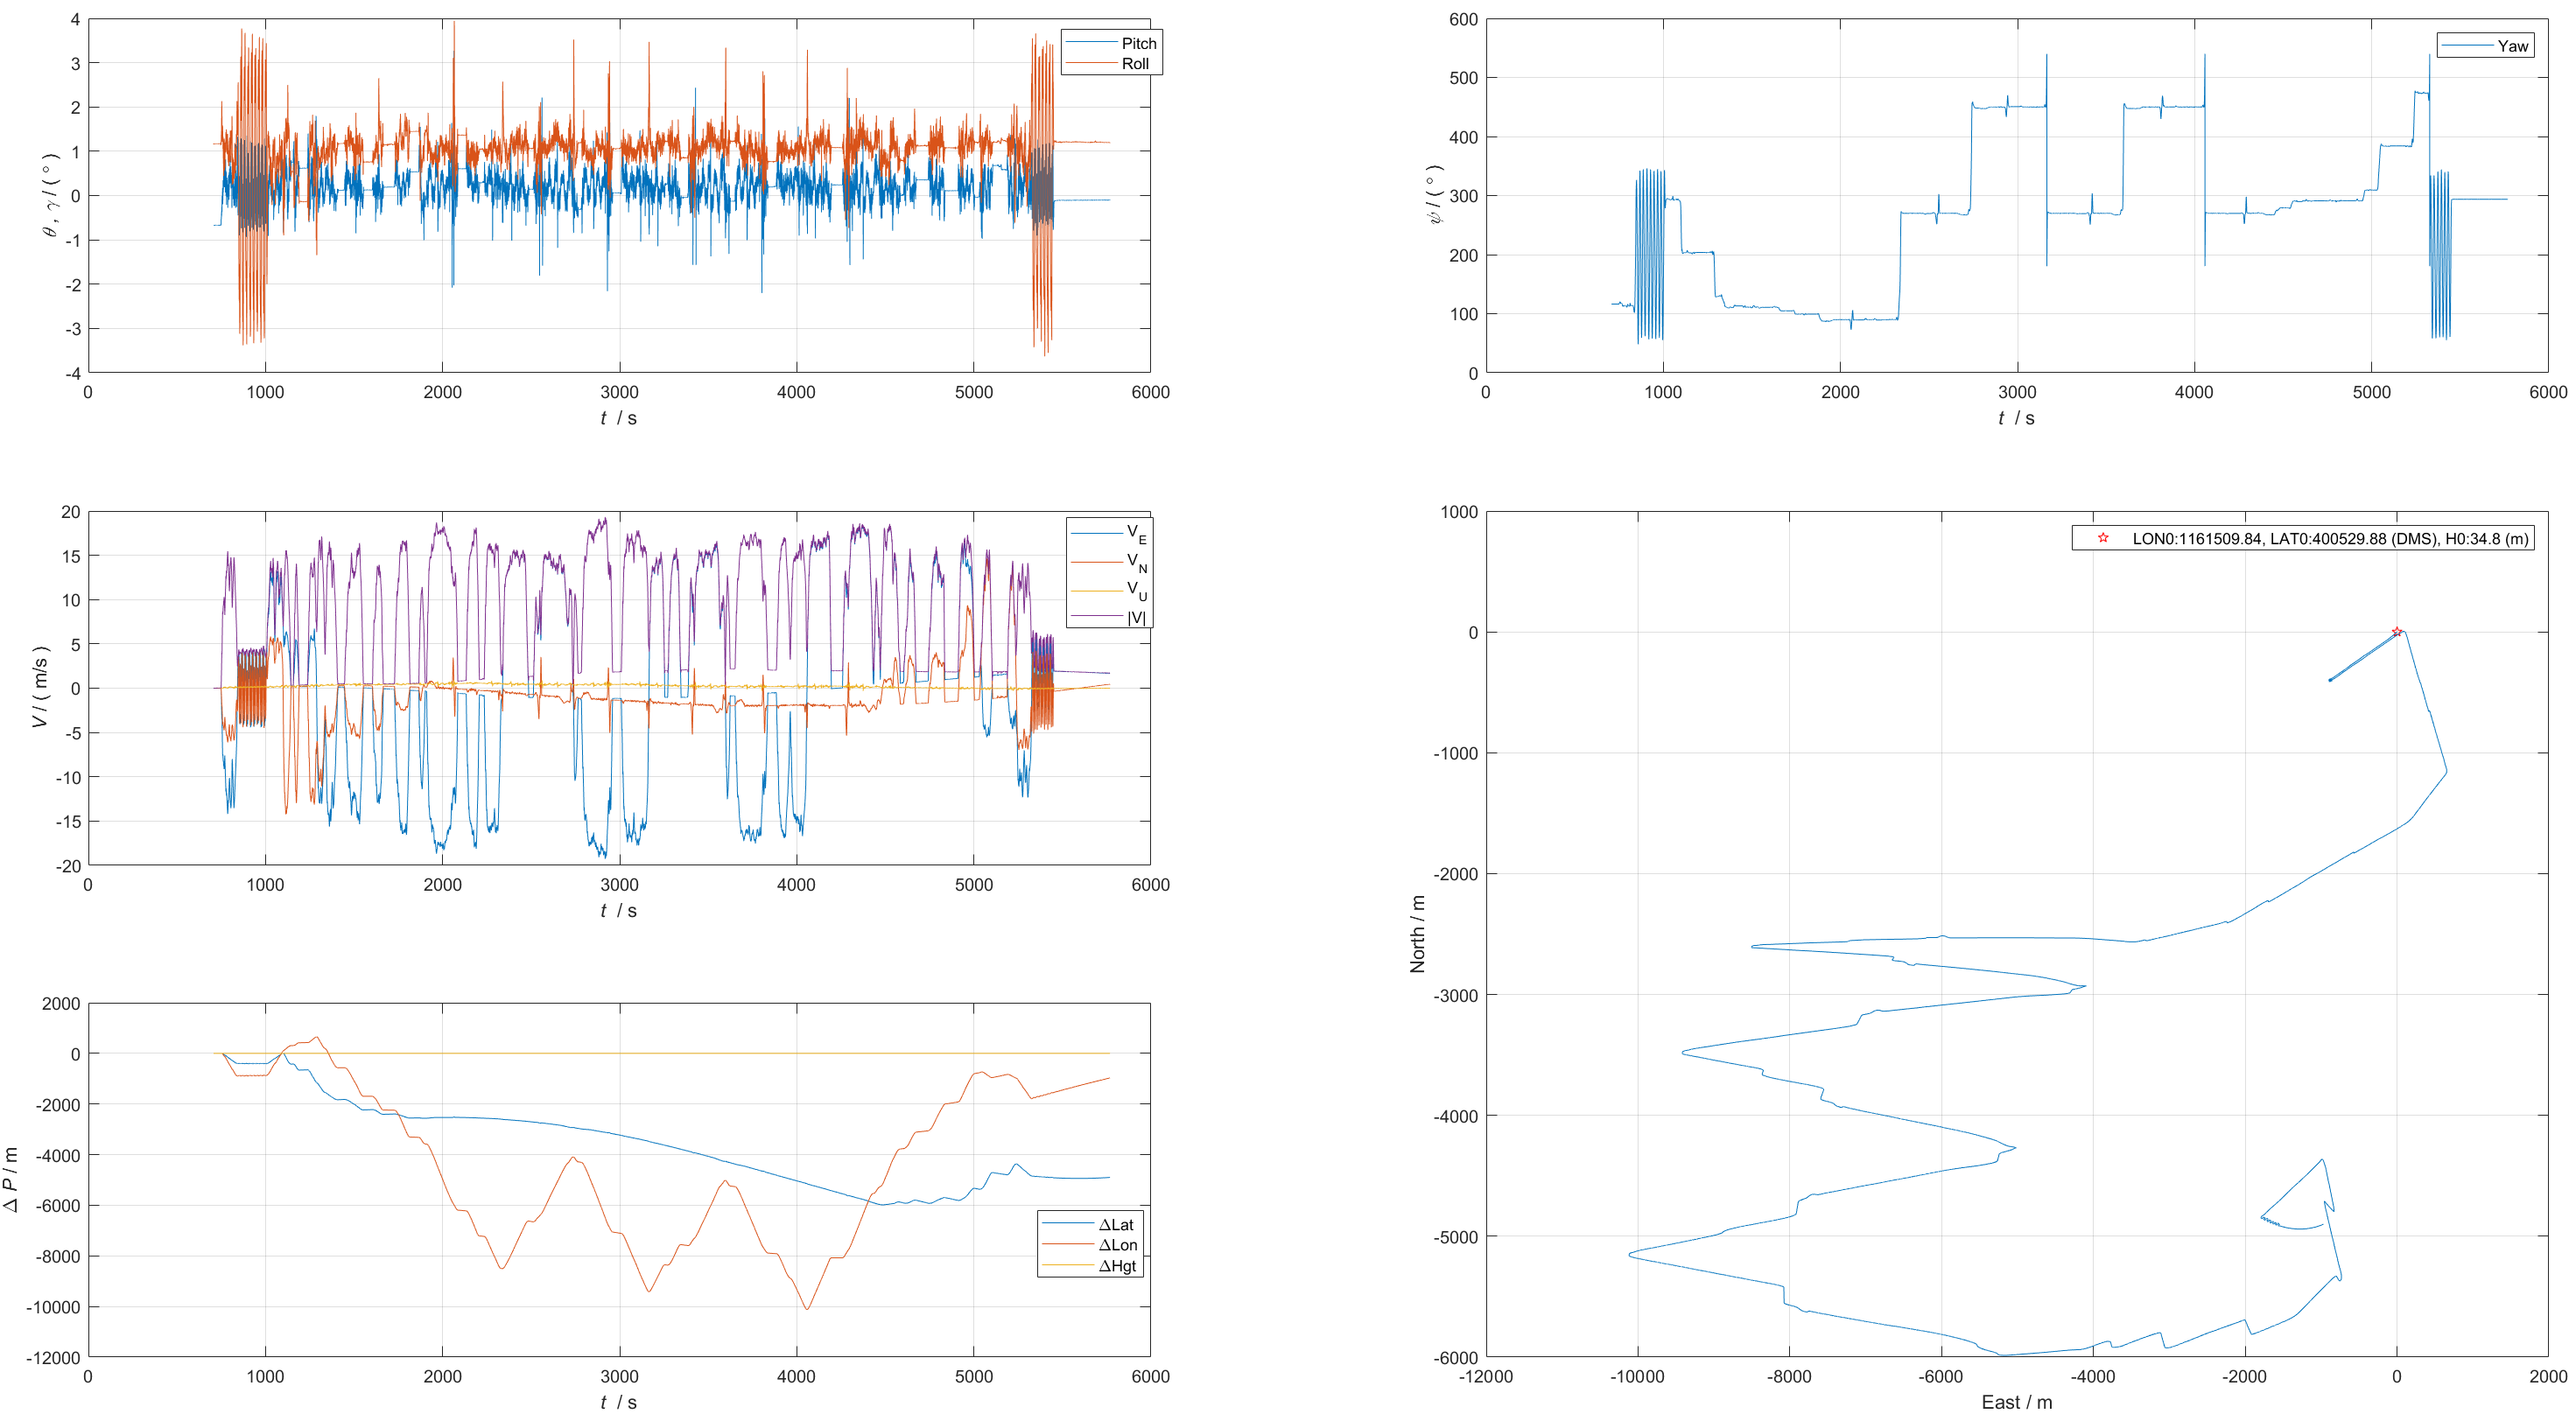
测试数据集3
FOG惯组为IMU-ISA-100C,采样频率为100Hz;
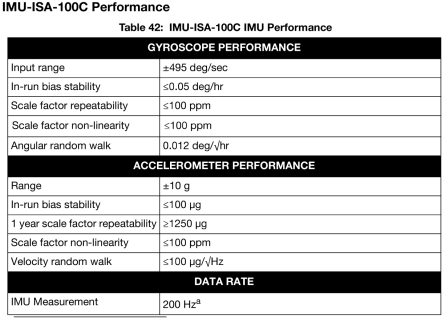
GPS采用差分,输出频率10Hz。
先静止690s(可自主对准),然后跑车约5460s (90min, 1.5h),再静止300s。
该数据中有IE软件处理的AVP参考输出10Hz,可做对比分析。
利用Matlab/PSINS Toolbox进行数据加载和一些简单测试程序如下:
glvs;
ts = 1/100;
load imuisa100avpgsp.mat
att = aligni0(imu(600/ts:700/ts,:), gps(1,4:6)');
ins = insinit([att;gps(1,1:6)'], ts);
avperr = avperrset([60;300], 1, 10);
imuerr = imuerrset(0.1, 1000, 0.01, 25);
Pmin = [avperrset([0.2,1.0],0.01,0.2); gabias(0.01, [10,10]); [0.01;0.01;0.01]; 0.001].^2;
Rmin = vperrset(0.1, 0.3).^2;
[avp1, xkpk1, zkrk1, sk1] = sinsgps(imu(700/ts:5500/ts,:), gps, ins, avperr, imuerr, rep3(1), 0.1, vperrset(0.1,10), Pmin, Rmin, 'avped');
avpcmpplot(avpie, avp1);
imu1 = imudeldrift(imu, avp1, 4000);
att1 = aligni0(imu1(400/ts:700/ts,:), gps(1,4:6)');
avp2 = inspure(imu1(700/ts+1:end,:),[att1;gps(1,4:6)'],'H');
avpcmpplot(avpie, avp2);
%% IMU-ISA-100C
close all;clear;
glvs;
ts = 1/100;
load imuisa100avpgsp.mat
%%%%%%%%%%%%%%%%%%%%%%%
% integrated navigation
att = aligni0(imu(600/ts:700/ts,:), gps(1,4:6)');
ins = insinit([att;gps(1,1:6)'], ts);
avperr = avperrset([60;300], 1, 10);
imuerr = imuerrset(0.1, 1000, 0.01, 25);
Pmin = [avperrset([0.2,1.0],0.01,0.2); gabias(0.01, [10,10]); [0.01;0.01;0.01]; 0.001].^2;
Rmin = vperrset(0.1, 0.3).^2;
[avp1, xkpk1, zkrk1, sk1] = sinsgps(imu(700/ts:5500/ts,:), gps, ins, avperr, imuerr, rep3(1), 0.1, vperrset(0.1,10), Pmin, Rmin, 'avped');
avpcmpplot(avpie, avp1);
%%%%%%%%%%%%%%%%%%%%%%%
% pure INS
imu1 = imudeldrift(imu, avp1, 4000);
att1 = aligni0(imu1(400/ts:700/ts,:), gps(1,4:6)');
avp2 = inspure(imu1(700/ts+1:end,:),[att1;gps(1,4:6)'],'H');
avpcmpplot(avpie, avp2);
% error of pitch and roll between pure ins and integrated navigation
myfigure;
t11 = avpie(:,end);
t22 = avp2(:,end);
subplot(221), plot(t11, avpie(:,1:2)/glv.deg,'-.','LineWidth',2), xygo('pr');
hold on, plot(t22, avp2(:,1:2)/glv.deg), xygo('pr'); %legend('Pitch','Roll');
legend('Pitch INS&GPS', 'Roll INS&GPS', 'Pitch pureINS', 'Roll pureINS');
subplot(223), plot(t11, yawplot(avpie(:,3)/glv.deg),'-.','LineWidth',2), xygo('y');
hold on, plot(t22, yawplot(avp2(:,3)/glv.deg)), xygo('y'); %legend('Yaw');
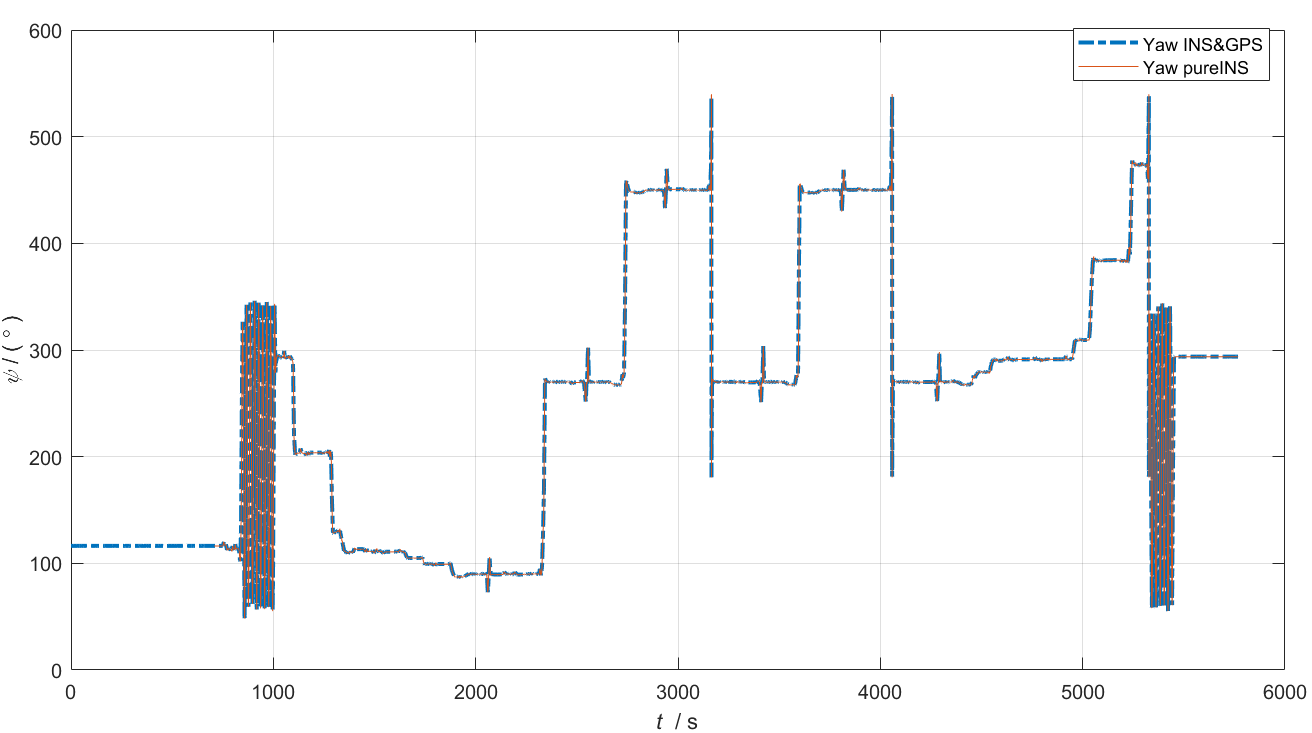
legend('Yaw INS&GPS', 'Yaw pureINS');
err = avpcmp(avp2(:,[1:3,end]), avpie(:,[1:3,end]), 'mu');
t33 = err(:,end);
subplot(222), hold on, plot(t33, err(:,1:2)/glv.min); xygo('mu'); mylegend('mux','muy');
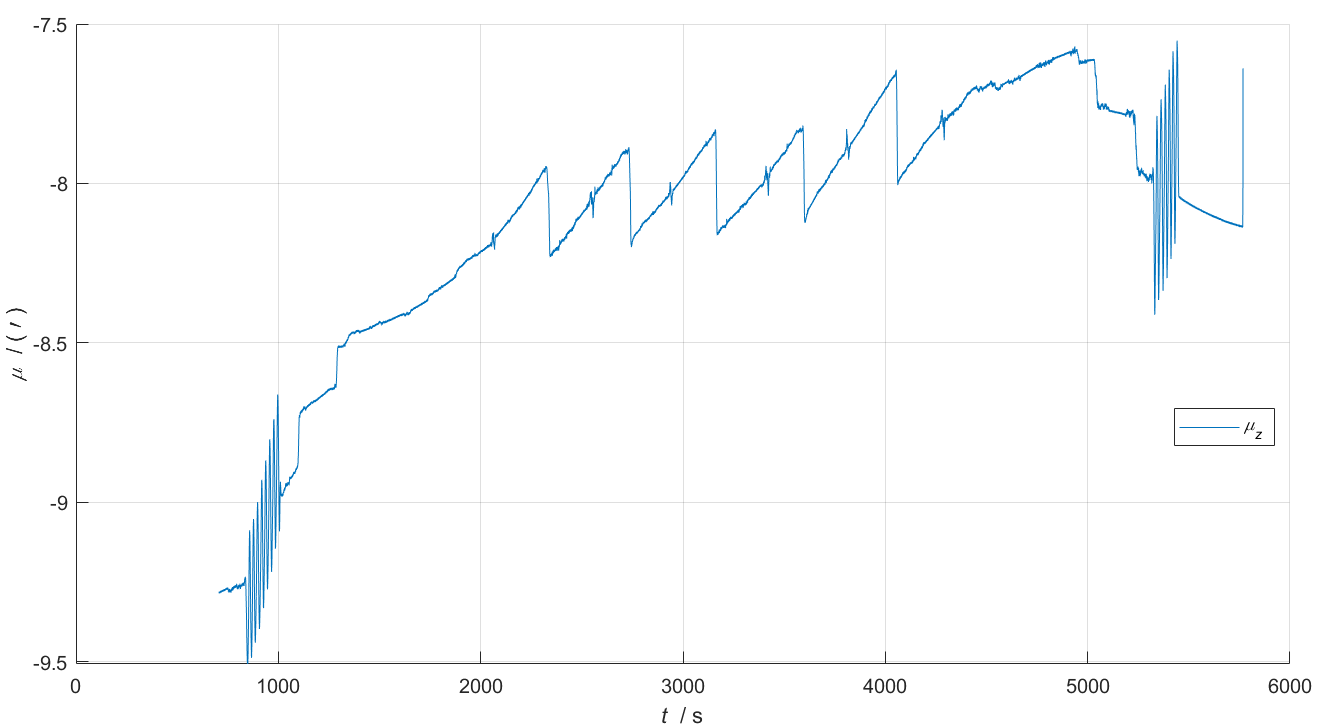
subplot(224), hold on, plot(t33, err(:,3)/glv.min); xygo('mu'); mylegend('muz');
AVP-IE 参考输出结果
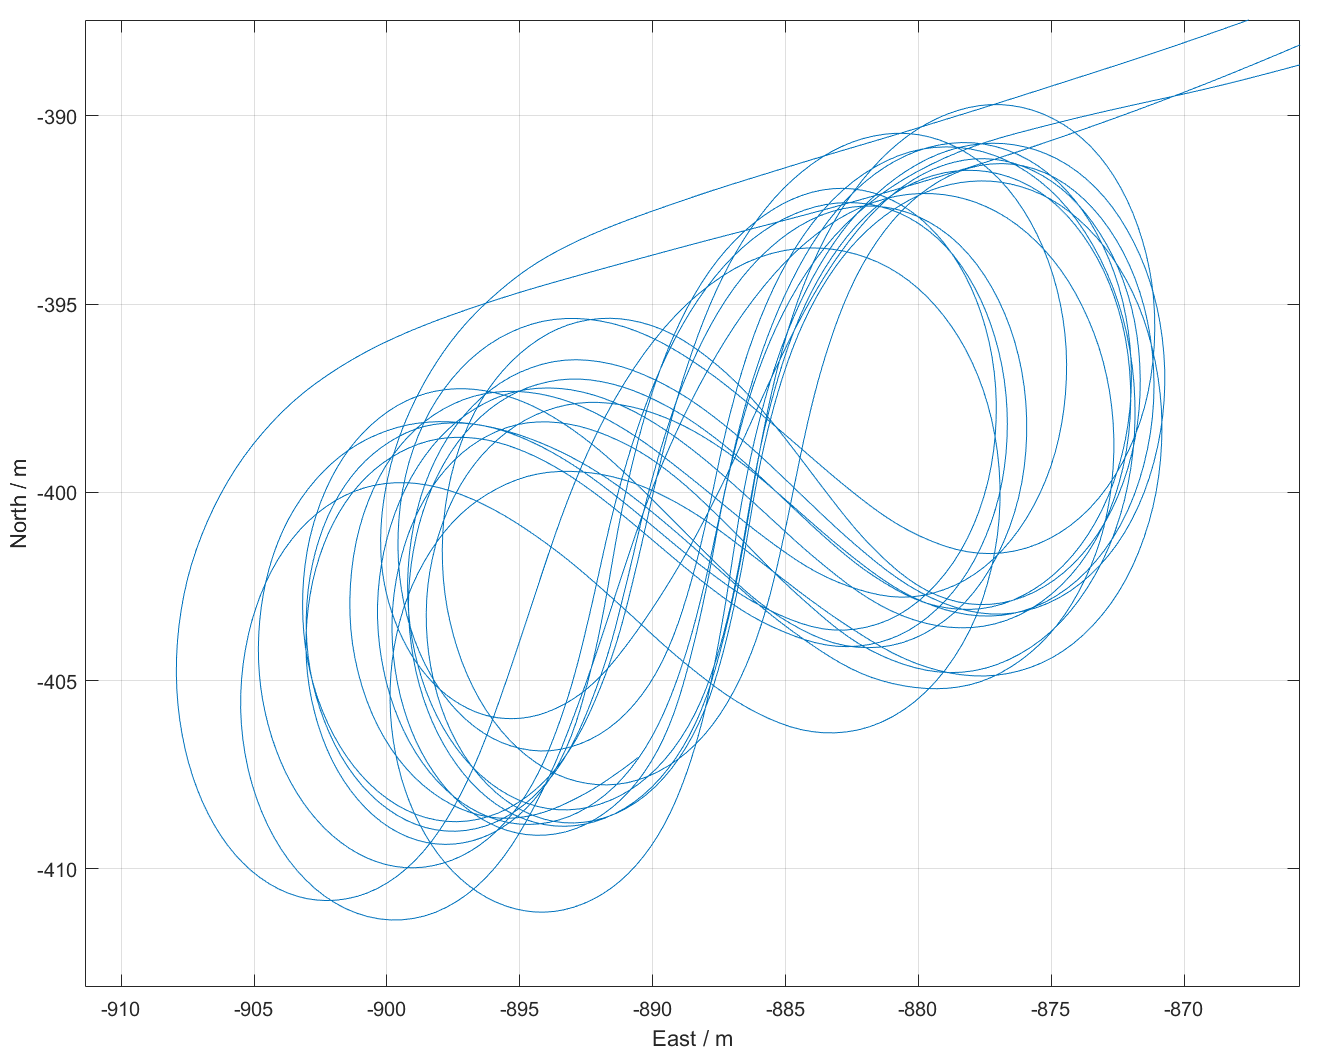
惯导初始对准结果
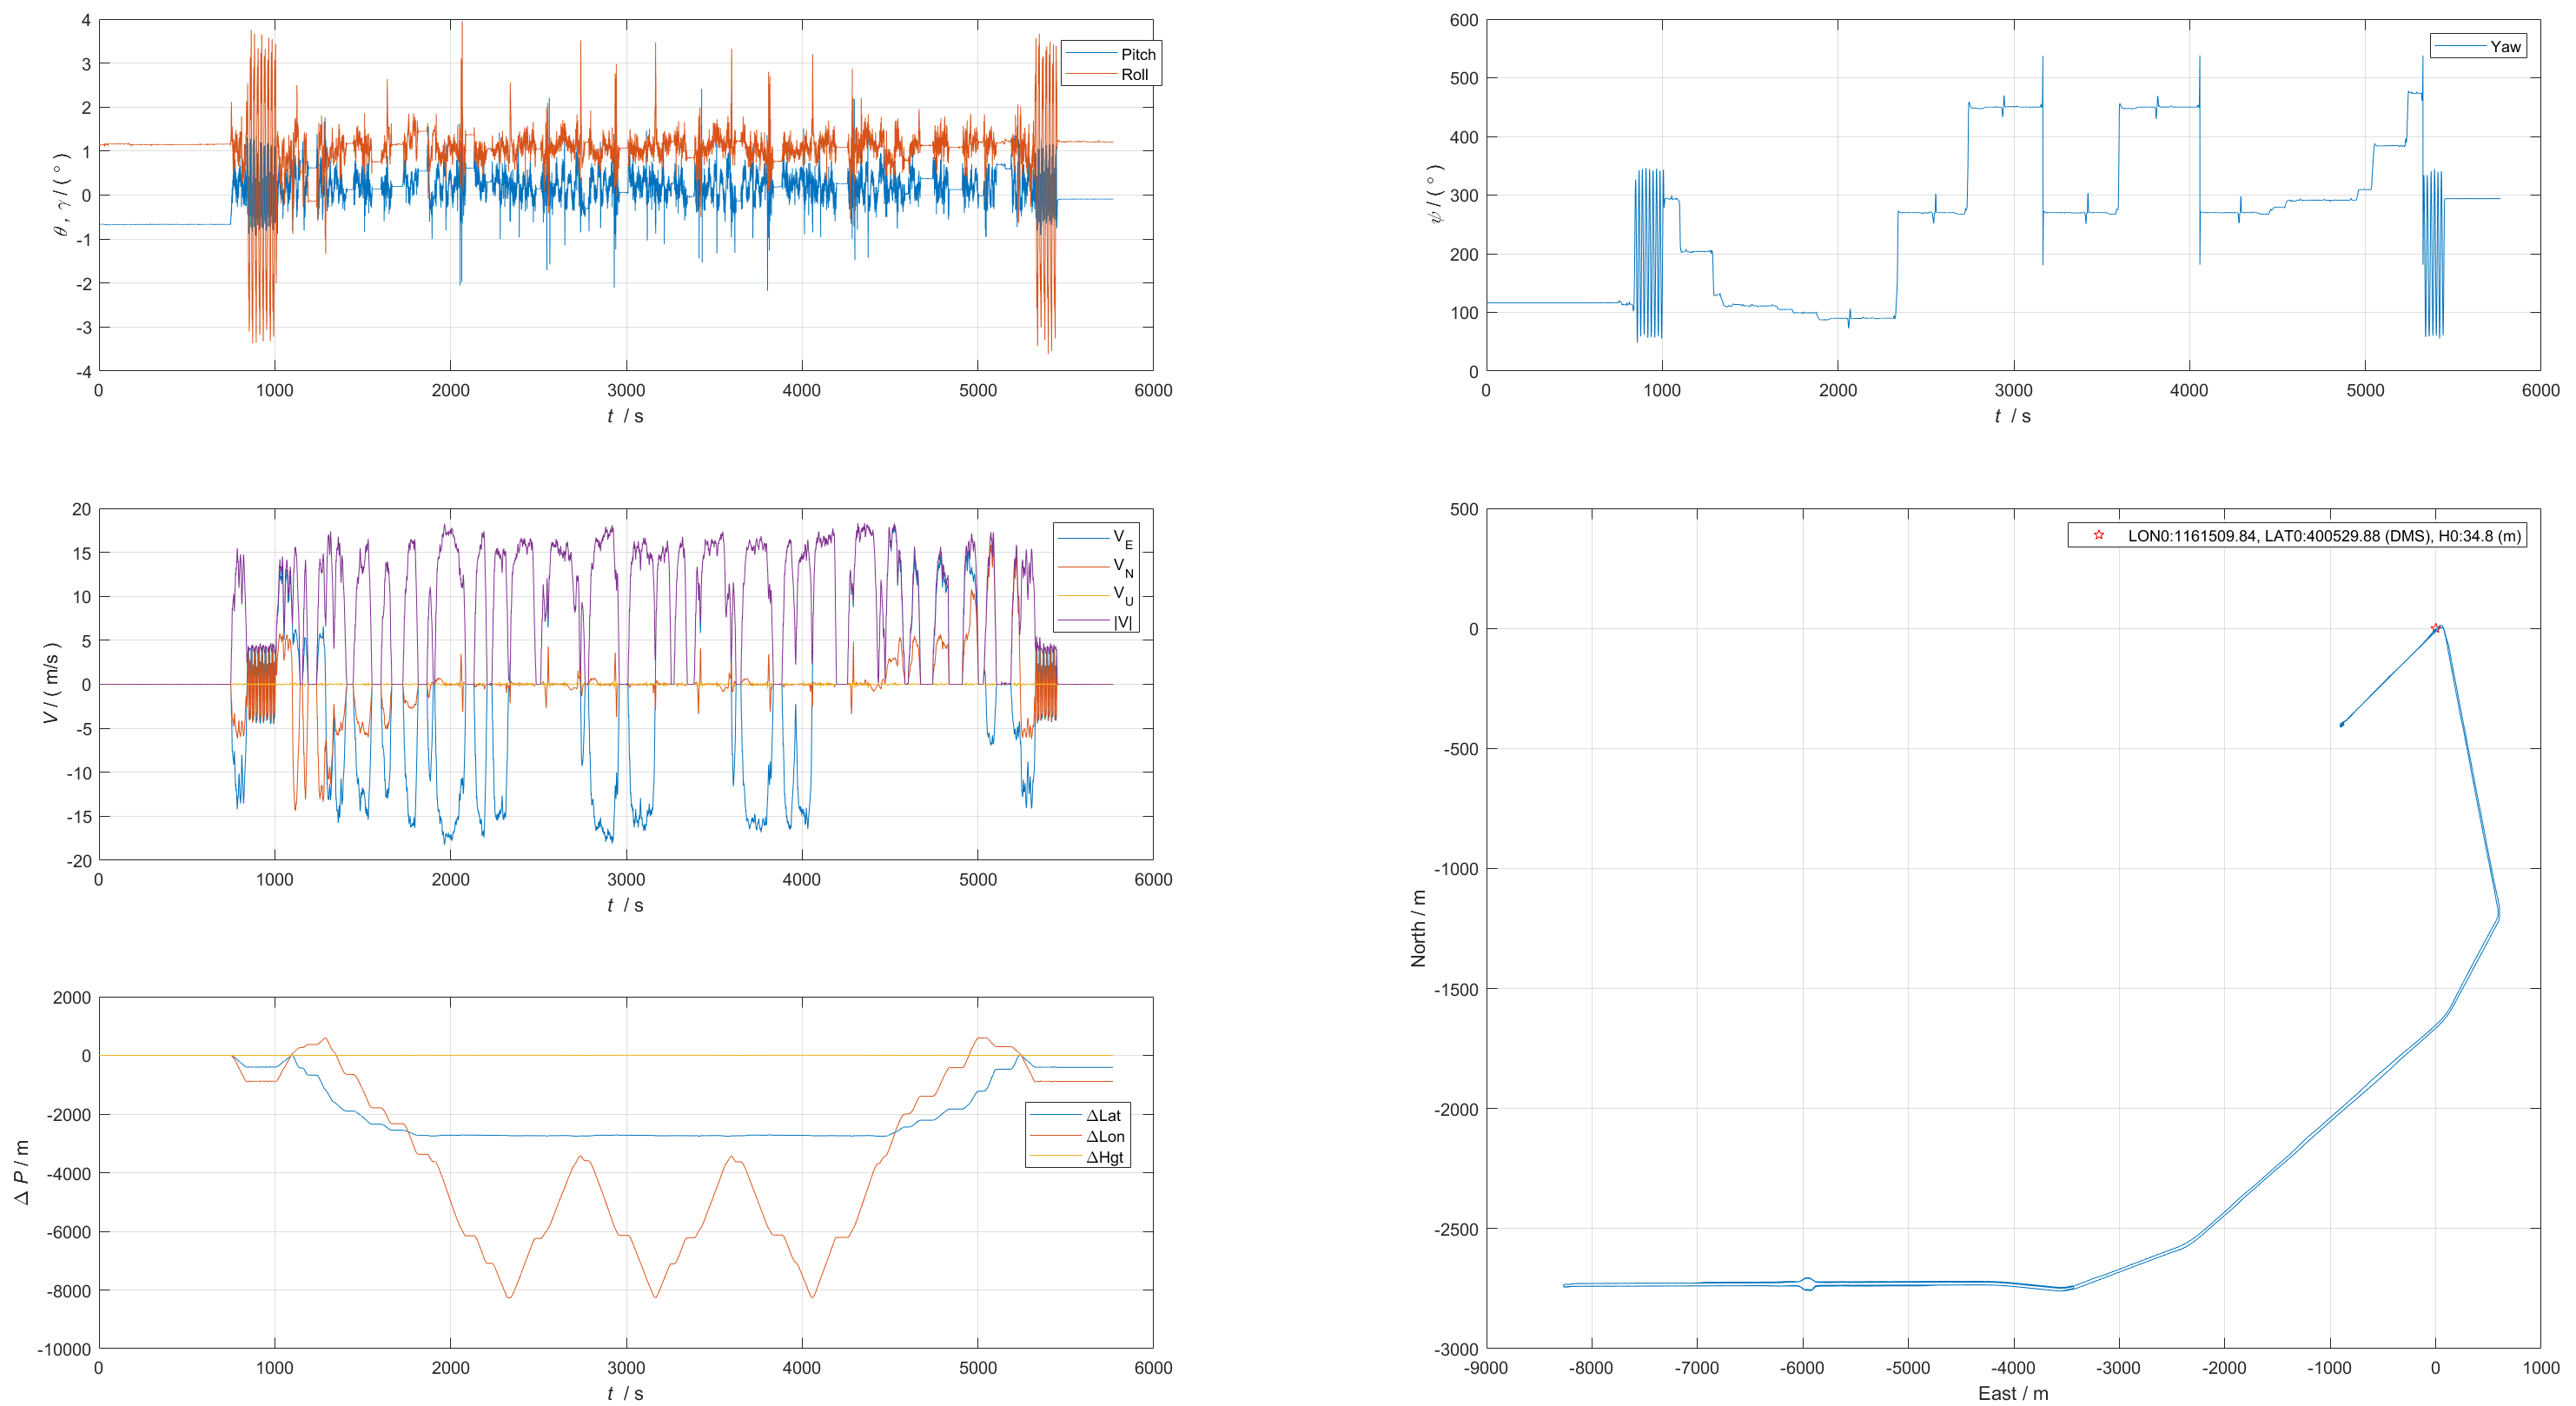
纯惯导输出结果
光纤纯惯导与AVP-IE姿态结果对比
测试结果总结
| 数据来源 | 惯性器件 | 采样频率 | 时长 | 姿态误差 | 航向误差 | 参考源 | |
|---|---|---|---|---|---|---|---|
| 1 | 西安中科华芯测控有限公司 | 惯性级激光惯导 | 200Hz | 33min | 50’ | 角速率大时两者差值波动大(<30deg),较小时两者差值较平稳(<5deg) | CNS(大视场星敏,标称精度20’‘) |
| 2 | 大连理工大学 | FOG惯组 | 100Hz | 3h | 50’ | 2.5h以内航向角偏差较小(<2deg),2.5h-3h有明显误差累积(<17deg) | INS-GNSS组合导航 |
| 3 | FOG惯组(IMU-ISA-100C) | 100Hz | 1.5h | 1‘ | 10’ | 外部提供的AVP参考 |
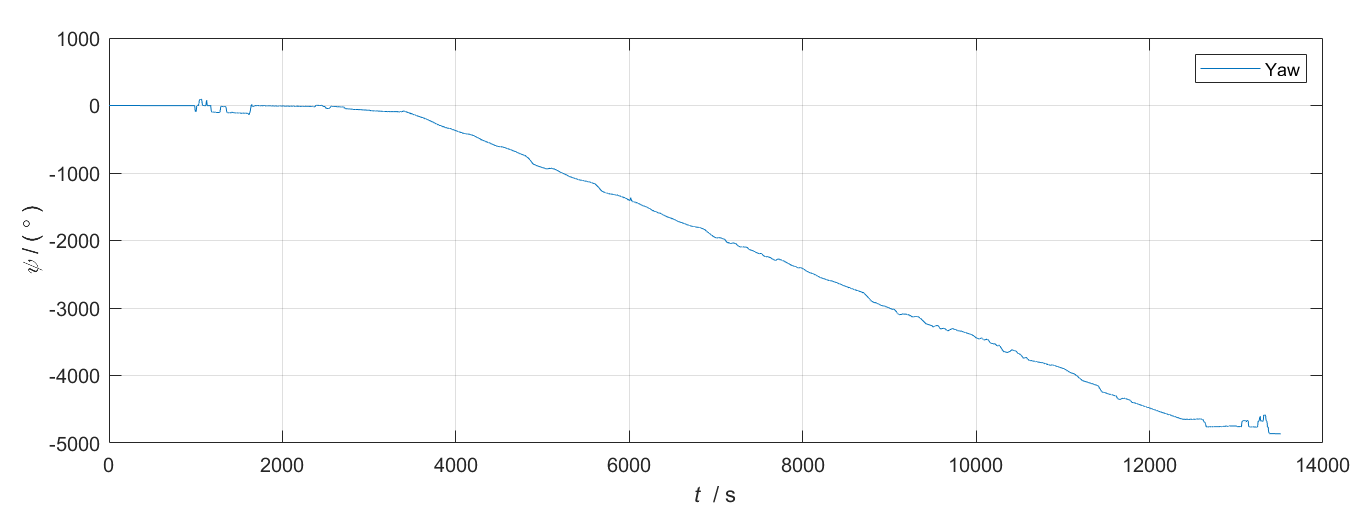
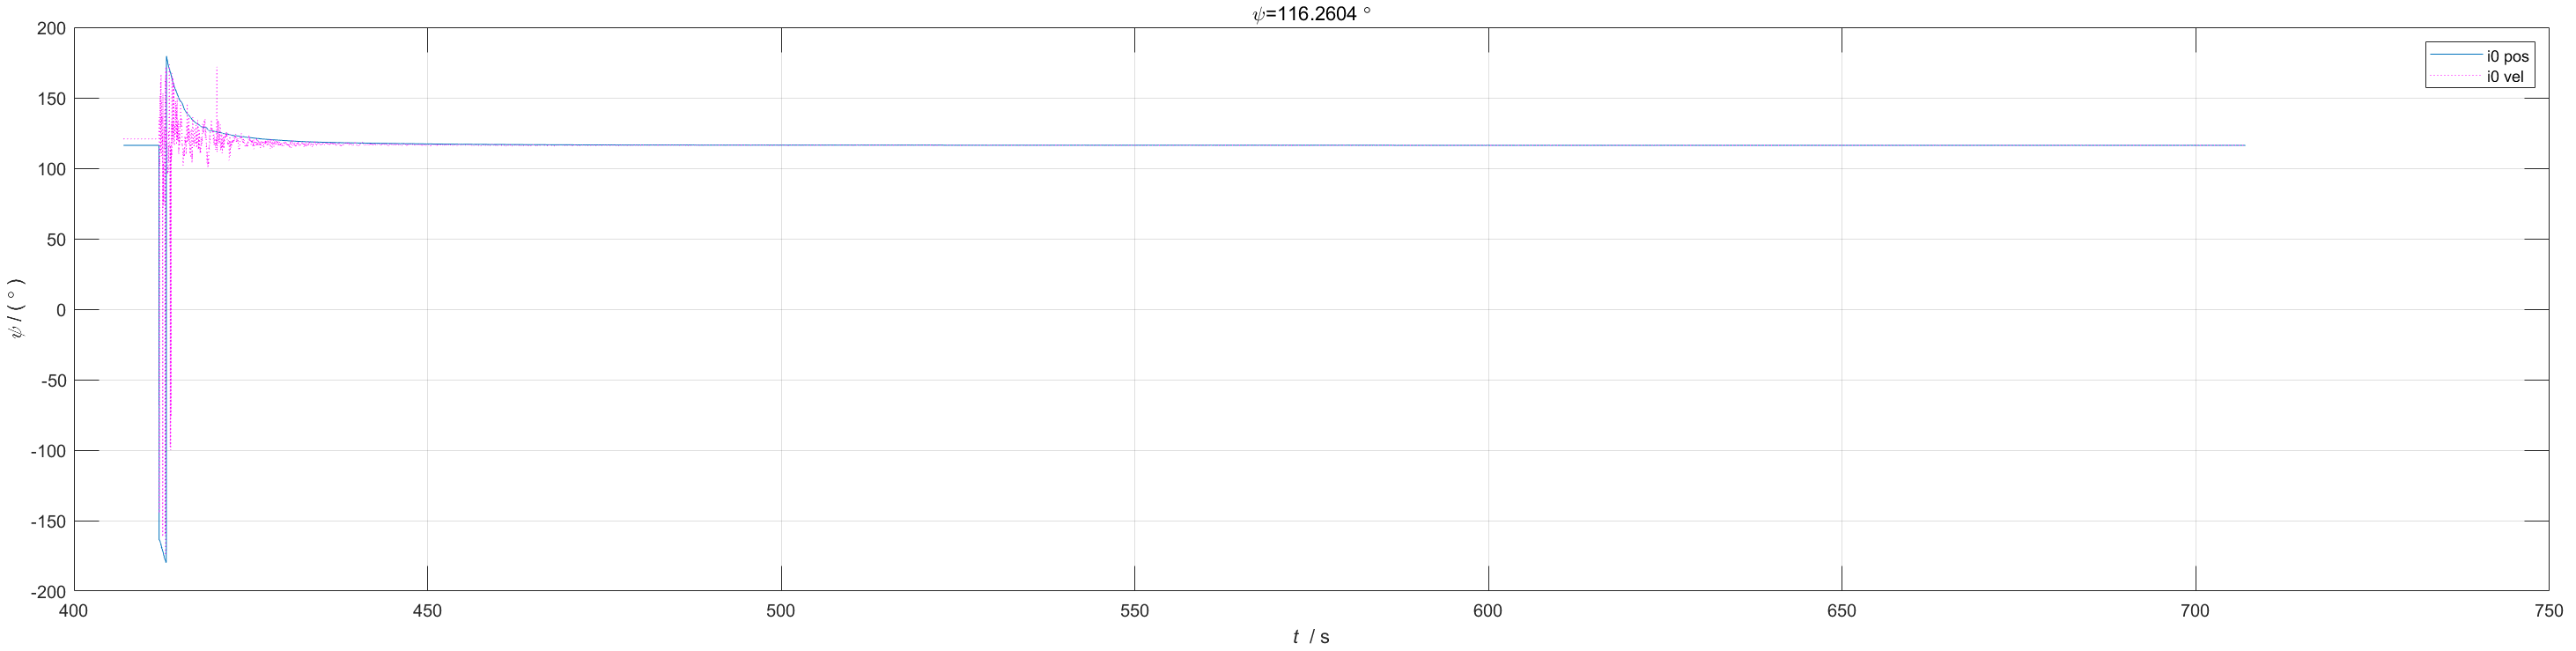
yawplot函数
作用: 将限制在 -180deg ~180deg之间的角度, 转换为连续变换的角度。
yawplot.m文件:
function y=yawplot(yaw)
y=yaw;
delta_yaw=0;
for k=1:size(yaw,1)
    if k==1
        continue;
    else
        if yaw(k)-yaw(k-1)<-300
            delta_yaw=delta_yaw+360;
        else
            if yaw(k)-yaw(k-1)>300
                delta_yaw=delta_yaw-360;
            end
        end
        y(k)=yaw(k)+delta_yaw;
    end
end
在insplot.m文件中:
yaw=yawplot(avp(:,3)/glv.deg);
subplot(322), plot(t, yaw); xygo('y'); legend('Yaw');
变换前:
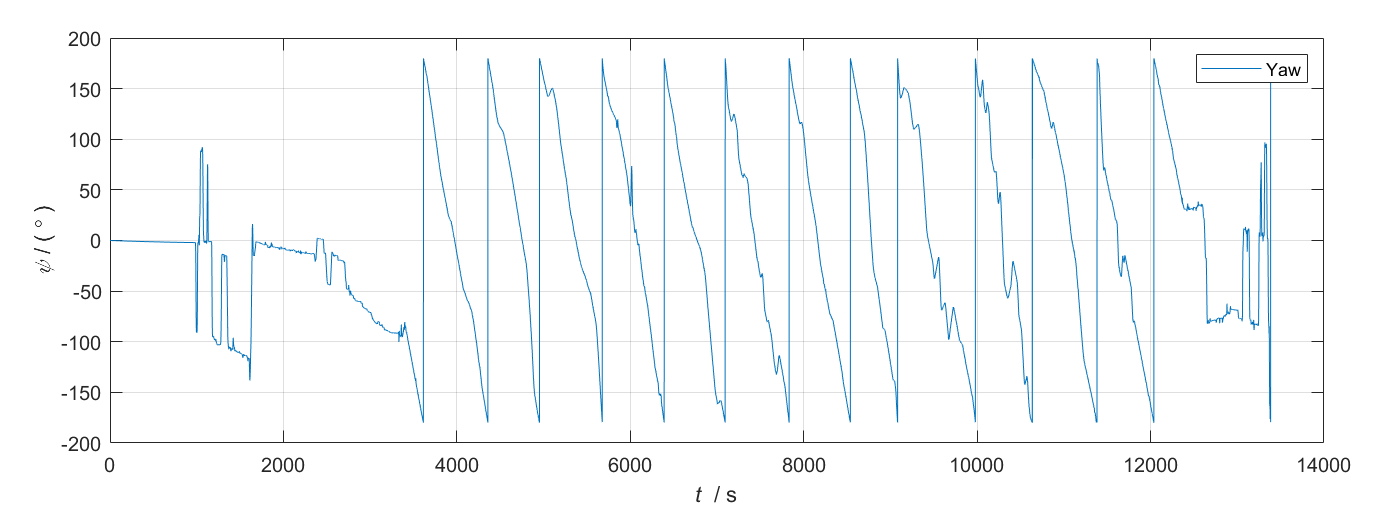
变换后: